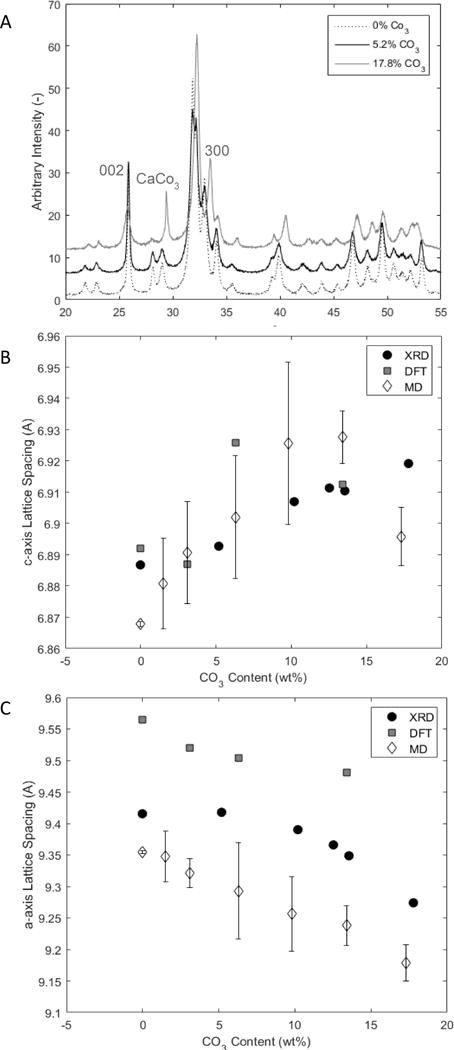
Figure 3.

A) XRD pattern for samples containing 0, 5.2, and 17.8 wt% carbonate. The (002) and (300) peaks shift in opposite directions with increased carbonate content. These shifts represent changes in the lattice spacing. B) Lattice spacing along the c-axis as a function of carbonate content measured experimentally from the XRD pattern and theoretically via DFT and MD methods. c-axis lattice spacing increases with the addition of carbonate. C) Lattice spacing along the a-axis as a function of carbonate content measured experimentally from the XRD and theoretically via DFT and MD methods. a-axis lattice spacing decreases with the addition of carbonate.
