Figure 4.

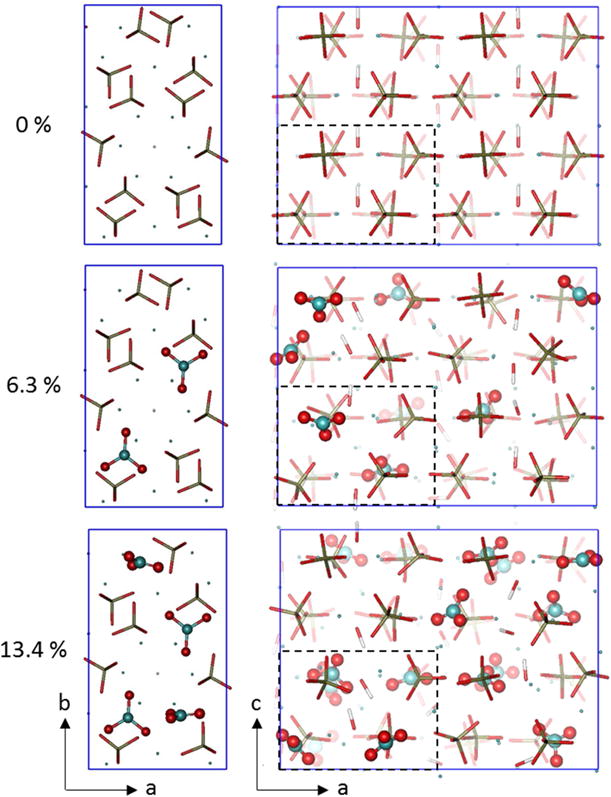
Schematic showing B-type carbonate (shown as wt%) substitution (atoms explicitly shown) for phosphate groups (only bonds shown) in the model. Apatite lattice models shown here are used for the MD and DFT calculations.

Schematic showing B-type carbonate (shown as wt%) substitution (atoms explicitly shown) for phosphate groups (only bonds shown) in the model. Apatite lattice models shown here are used for the MD and DFT calculations.