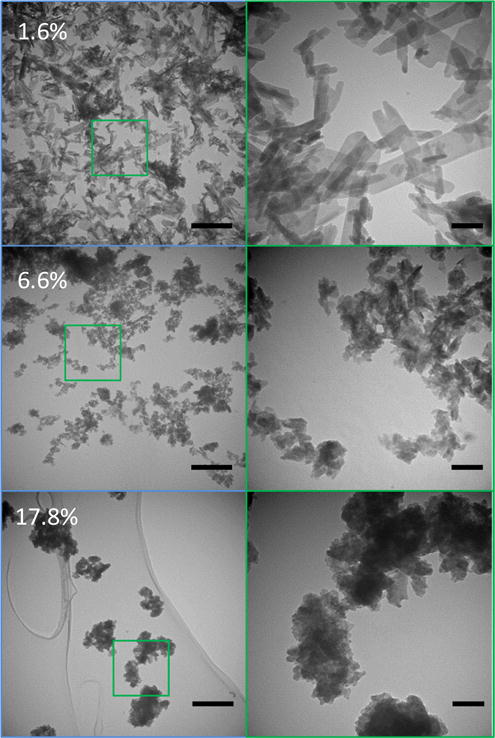
Figure 5.

TEM images of three carbonated apatites containing 1.6%, 6.6%, and 17.8 % carbonate by weight. Right hand images are 4× enlargements of indicated areas on the left… As carbonate content increases, the particles tend be smaller and have a greater propensity for aggregation. Scale bars are 500 nm for the left column, 100 nm for the right column.
