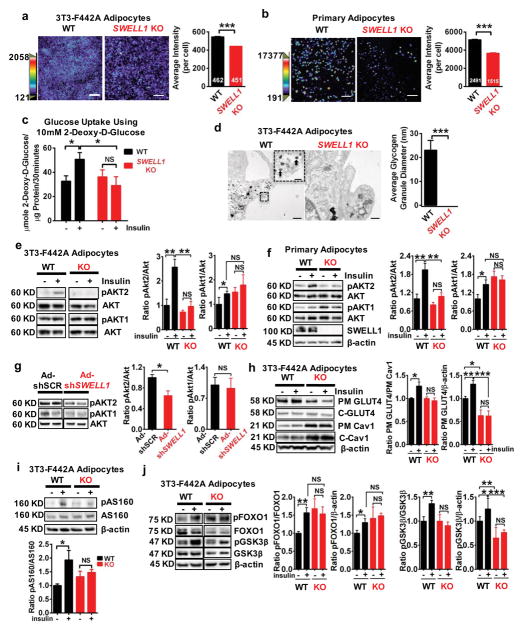
Figure 4. SWELL1 regulates lipid content and glucose metabolism via insulin-pAKT2-AS160-GLUT4 and GSK3β signaling.
Representative fluorescence images of AdipoRed stained (a) WT and SWELL1 KO 3T3-F442A adipocytes and (b) WT and SWELL1 KO cultured primary adipocytes. Average AdipoRed fluorescence intensity per cell in (a) WT 3T3-F442A (n = 462) and SWELL1 KO 3T3-F442A (n = 451) and (b) WT (n = 2491) and SWELL1 KO (n = 1515) cultured primary adipocytes. Measurements pooled from 3 and 4 separate experiments in (a) and (b), respectively. Scale bar: 200 μm. (c) Insulin-stimulated (100 nM) glucose uptake using 2-Deoxy-D-Glucose (n = 10 biologically independent samples per condition). (d) Transmission Electron Microscopy (TEM) images of glycogen granules and mean granule diameter in WT and SWELL1 KO 3T3-F442A adipocytes (n = 5 fields each). Scale bar: 0.5 μm. Inset shows granules (black arrows) in magnified area (Scale bar: 0.1 μm). Western blots of insulin-stimulated pAKT2, pAKT1, and AKT in (e) WT and SWELL1 KO 3T3-F442A adipocytes (0, 100 nM insulin) and (f) WT and SWELL1 KO primary cultured adipocytes (0, 10 nM). N=4 independent experiments in (e), and N=6 for AKT2 and N=7 for pAKT1 in (f). (g) Western blots of insulin-stimulated pAKT2, pAKT1, and AKT from mouse iWAT injected with Ad-shSCR or Ad-shSWELL1. N=4 independent experiments. (h) Western blots of insulin-stimulated (0, 100 nM) plasma membrane (PM) GLUT4, cytosolic (C) GLUT4, PM and C Cav1 and β-Actin in WT and SWELL1 KO 3T3-F442A adipocytes. Quantification of insulin-stimulated PM GLUT4/PM Cav1 (normalized to unstimulated), PM GLUT4/β-actin. N=6 independent experiments. (i,j) Western blots of insulin-stimulated (0, 100 nM) pAS160, AS160, pGSK3β, GSK3β, pFOXO1, FOXO1 and β-actin in WT and SWELL1 KO 3T3-F442A adipocytes. N=4 independent experiments for pAS160 and N=6 for pFOXO1 and pGSK3β. Significance between the indicated groups in a–c, e–j were calculated using a two-tailed Student’s t-test. Wilcoxon-test used for statistical significance in d. Exact P-values are listed in Supplementary Table 6. Uncropped blots for e–j are shown in Supplementary Fig. 9b–p. Statistics source data for e–j can be found in Supplementary Table 7. Error bars represent mean ± s.e.m. *(P < 0.05), **(P < 0.01), ***(P < 0.001). See also Supplementary Figure 4.

