Figure 1.
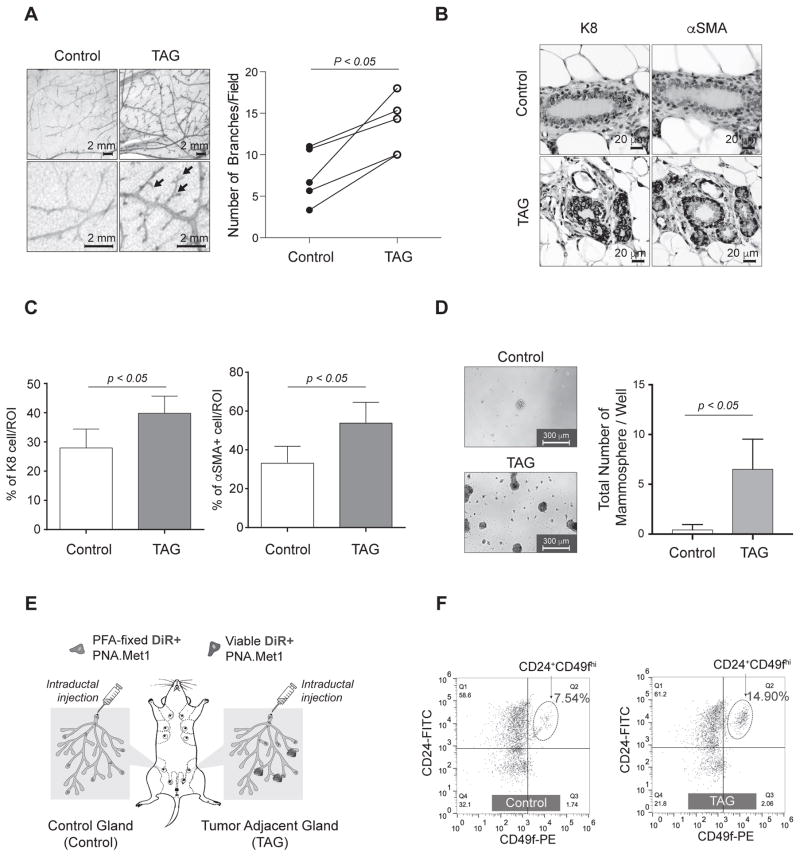
Tumor development deregulates the mammary gland microenvironment and alters stromal cells. A, Left, whole mount analysis of control (left) and tumor-adjacent (TAG, right) mammary glands. Arrows indicate branch points. Right, branch point quantification of matched control and tumor-adjacent glands, with analysis from paired t-test. B, Representative images of IHC staining of cytokeratin 8 (K8) and α-smooth muscle actin (α-SMA) in control (top) and TAG (bottom). C, Quantification of IHC (shown in B) of percent of K8+ and α-SMA+ cells per 40× region of interest (ROI) in both control and TAG. D, Representative images of both control and TAG mammospheres with corresponding quantifications at day 10 post-plating. E, Schematic depicting experimental strategy for intraductal injection experiments. F, FACS plot of MaSCs from both control (left) and TAG (right) mammary glands.

