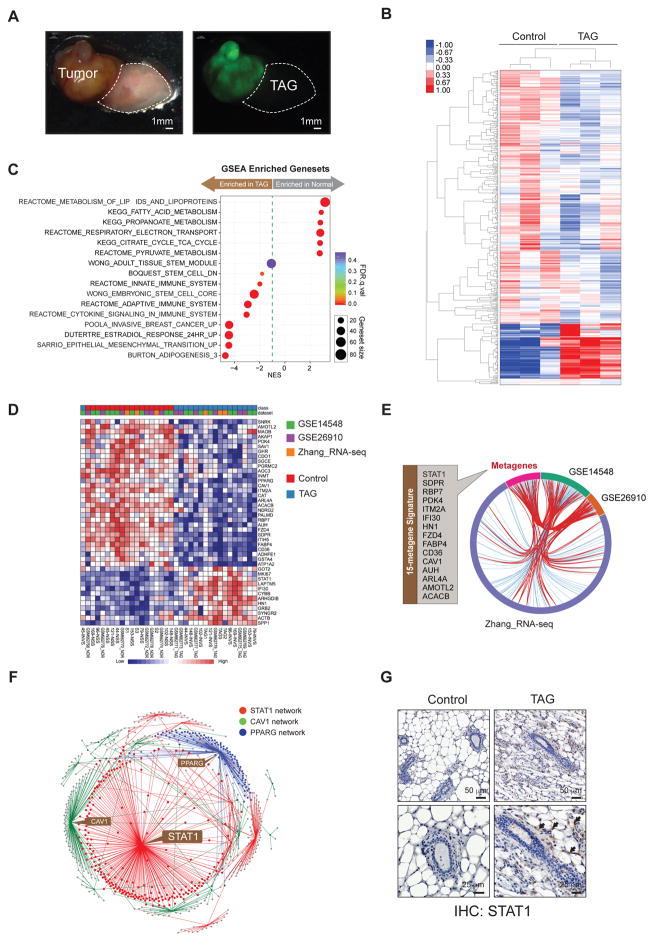
Figure 2.
STAT1 is a Central Node of Tumor Stimulated Stromal Signature. A, Bright field (left) and fluorescent (right) images of ZsGreen PNA.Met1 xenograft tumor and tumor associated gland (TAG). Dashed line indicates tumor-adjacent tissue extracted for RNA-sequencing. B, Clustering analysis showing the top DE genes in control and TAG groups. C, Cleveland plot of gene set enrichment analysis (GSEA) from all DEGs (p < 0.05, q < 0.25) with curated gene sets (C2) from the Molecular Signature Database (MSigDB). D, Heat map of top 42 DEGs (FDR p < 0.05) from meta-analysis of Zhang_RNA-seq with GSE14548 and GSE26910. E, Chord diagram of 15 meta-genes (red line) shared among all three datasets (Zhang_RNAseq, GSE14548, and GSE26910). F, Nodal network generated from the 15 meta-gene signature showing the top three ranked nodes. G, Representative images of IHC staining for STAT1 in control (left) and TAG (right).

