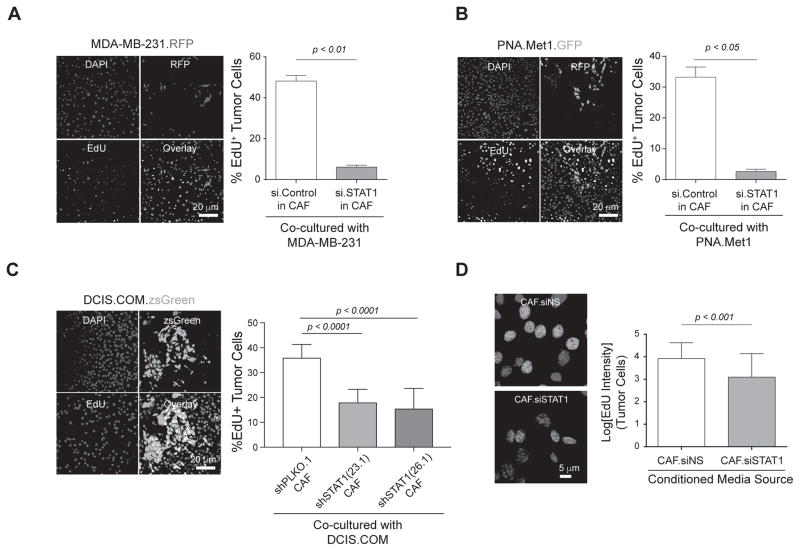
Figure 3.
Fibroblast STAT1-mediated Pentraxin 3 (PTX3) secretion promotes tumor cell proliferation. A, Left: Representative images of EdU assay from tumor cells grown in co-culture with CAFs (siSTAT1). Blue: DAPI, Red: MDA-MB-231, Yellow: EdU+ cells, Pink: EdU+ cells in merged image. Right: Quantification of Percent EdU+ cells. B, Left: Representative images of EdU assay ZsGreen PNA.Met1 tumor cells in co-culture with CAFs as mentioned in A. Blue: DAPI, Green: ZsGreen PNA.Met1, Yellow: EdU+ cells. Right: Quantification of Percent EdU+ cells, Pink: EdU+ cells in merged image. C, Left: Representative images of EdU assay from DCIS.COM tumor cells cocultured with either shPLKO.1 (control) CAFs or with CAFs containing either construct of shSTAT1 (23.1 or 26.1). Blue: DAPI, Green: DCIS.COM, Red: EdU+ cells, Yellow: EdU+ cells in merged image. Right: Quantification of percent EdU+ cells. D, Left: Representative merged images of DAPI-stained DCIS.COM cells after treatment for 48 hours with conditioned media collected from siSTAT1 CAFs and non-silencing control (siNS) CAFs. Blue: DAPI, Pink: EdU+ cells. Right: Quantification represents log[EdU intensity] of PNA.Met1 cells.

