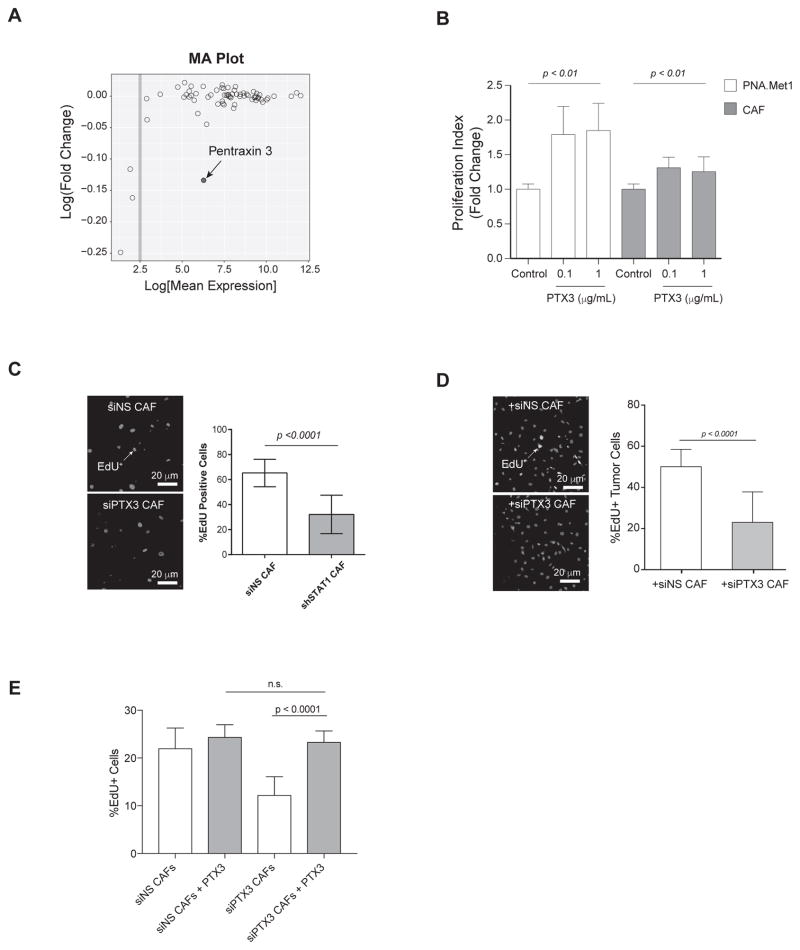
Figure 4. PTX3 is secreted by STAT1-expressing CAFs and promotes tumor cell viability and proliferation.
A, MA plot showing the cytokine array analysis. Log fold change is plotted as a function of log mean expression. Each circle represents one probe. B, Proliferation index of PNA.Met1 tumor cells and CAFs 24 hours after treatment with recombinant human pentraxin 3 in serum-free DMEM- F12. C, Left: Representative images of non-silencing control (siNS) CAFs (top) or PTX3-depleted CAFs (bottom). Blue: DAPI, Red: Red: EdU+ cells. Right: Quantification of percent EdU+ cells. D, Left: Representative images of MDA-MB-231 cells cocultured with non-silencing control (siNS) CAFs (top) or PTX3-depleted CAFs (bottom). Blue: DAPI, Red: Tumor Cells, Yellow: EdU+ cells. Right: Quantification of percent EdU+ cells. E, Quantification of percent EdU+ cells of non-silencing control (siNS) or PTX3-depleted (siPTX3) CAFs treated with vehicle or 1 μg PTX3 overnight.

