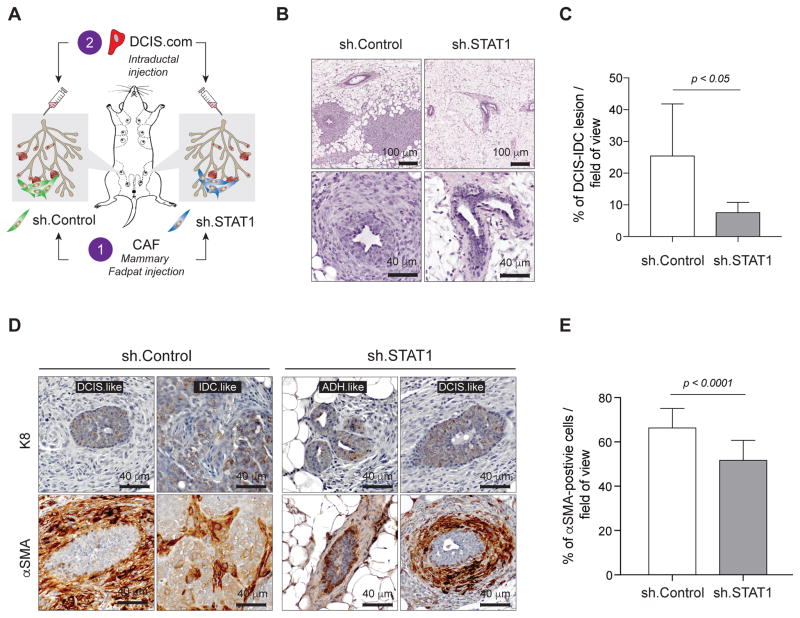
Figure 5. Stromal STAT1 influences progression of early stage breast cancer lesions in vivo.
A, Schematic depicting experimental strategy for intraductal injection experiments. Control CAFs were injected into one mammary fat pad (n = 5), while STAT1-depleted CAFs (shSTAT1) were injected into the contralateral fat pad (n = 5). After 24 hours, DCIS.COM cells were injected into the nipple of each mammary gland. B, Representative H&E images of tumor progress in glands injected with control CAFs (left) and shSTAT1 CAFs (right) at both 10× (top) and 40× (bottom). C, Mean percent of DCIS/IDC-like lesion per field of view in glands injected with control CAFs (n = 5) compared to glands injected with shSTAT1 CAFs (n = 5). D, Representative 40× images showing tumor lesions in glands injected with control CAFs (left) and shSTAT1 CAFs (right) stained with either human K8 (top row) or α-SMA (bottom row). DCIS: ductal carcinoma in situ, IDC: invasive ductal carcinoma, ADH: advanced ductal hyperplasia. E, Quantification of percent α-SMA+ cells per 40× field of view in 5 μm sections from mammary glands injected with sh.Control CAFs (left) or sh.STAT1 CAFs (right).

