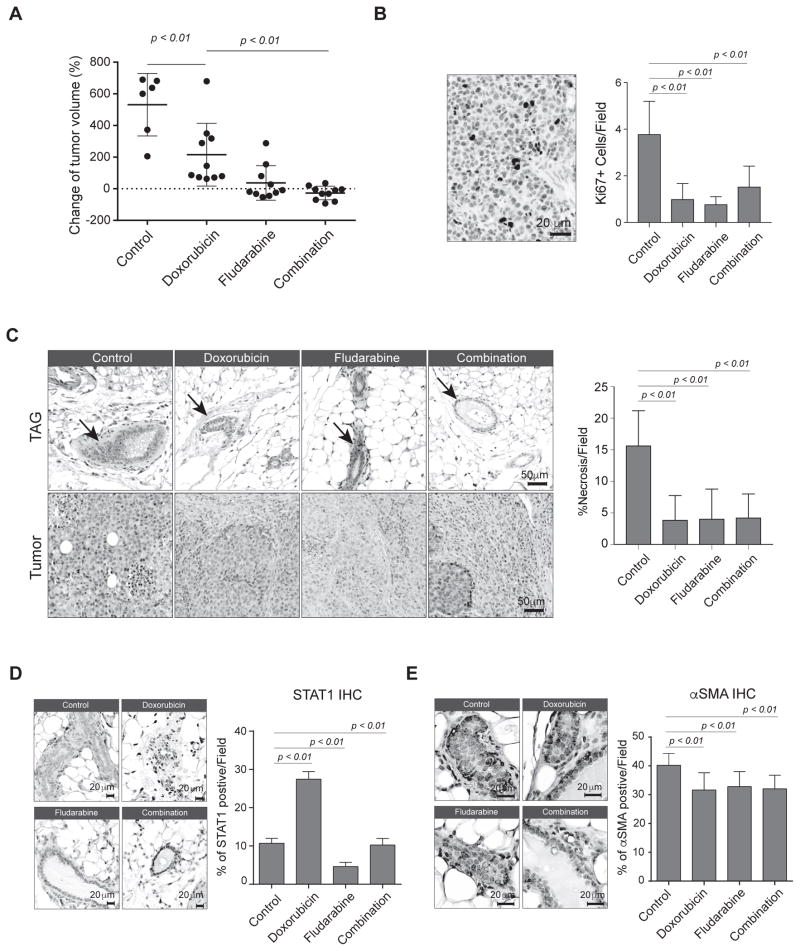
Figure 6.
Inhibition of stromal STAT1 enhances chemotherapeutic efficacy. A, Percent change of tumor volume at end point compared to day zero for each tumor in each treatment group: vehicle control (n = 6), doxorubicin (n = 10), fludarabine (n = 10), or combination of doxorubicin and fludarabine (n = 10). B, Left, representative image showing IHC for Ki67+ tumor cells in control treatment group. Right, mean number of Ki67+ cells per 40× field of view in each group. C, Hematoxylin and eosin (H&E) staining of tumors from each treatment group. Left, representative images showing the tissue morphology after the treatments. Right, bar graph showing the percent of necrosis in each 10× field of view. D, IHC analysis of STAT1 in TAG. Left, representative images of IHC STAT1. Right, STAT1+ cells per 40× field of view. E, IHC analysis of STAT1 in TAG a-SMA. Left, representative images of IHC α-SMA. Right, α-SMA+ cells per 40× field of view.

