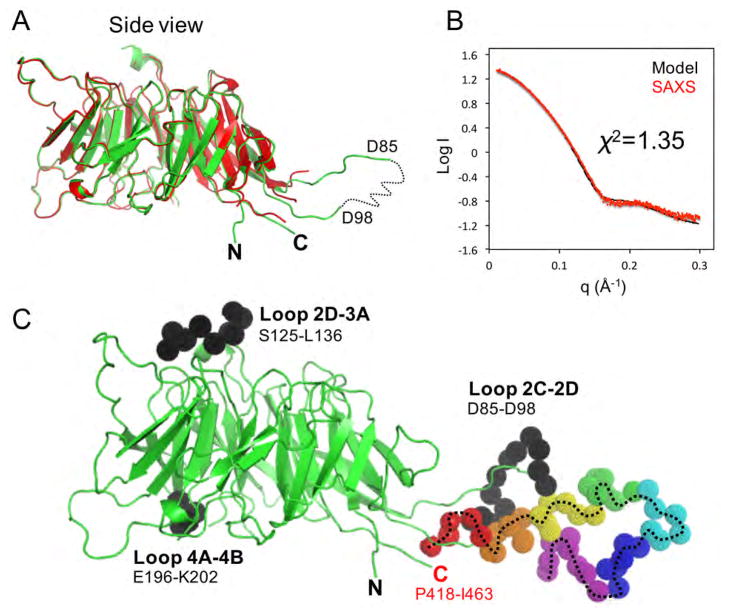
Figure 2.
SAXS analysis of full-length S. cerevisiae Nsa1. (A) Superposition of the orthorhombic (red) and cubic (green) crystal forms of Nsa1. (B) Comparison of the experimental SAXS scattering curve (red circles) with the scattering curve derived from the Bunch model of Nsa1 (black line) shown in C. (C) A combination of rigid body and ab initio modelling of Nsa1 determined by Bunch. The WD40 domain is shown in cartoon colored in green (crystal structure Nsa1FL: PDB 5SUM), the flexible C-terminus is shown as rainbow color spheres and the three missing loops are shown as black spheres. See also Figure S3, S4 and S5, and Table S1.

