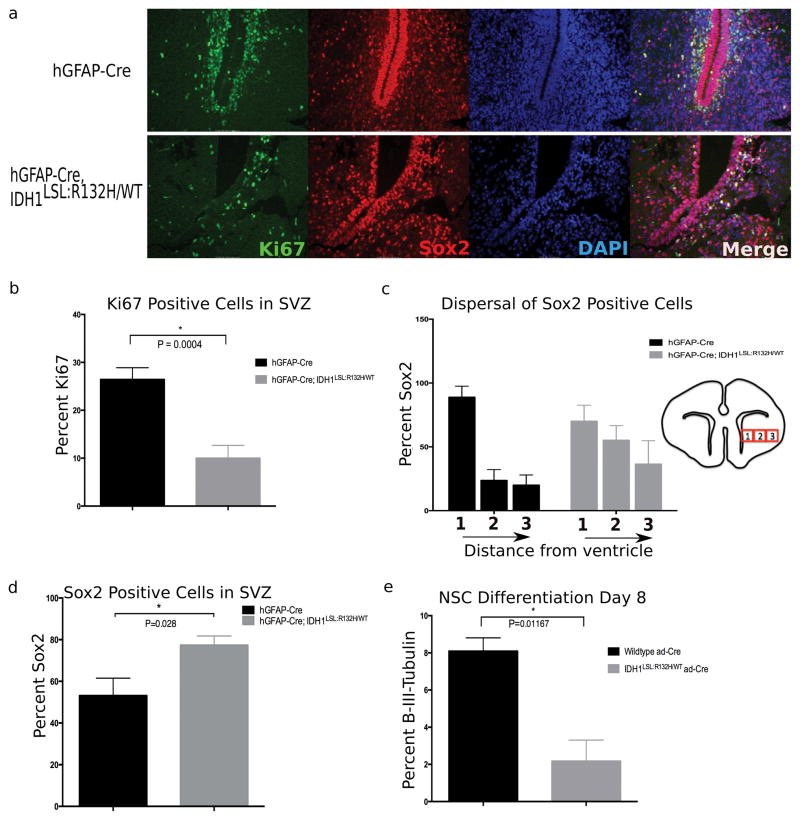
Figure 4. Broad CNS expression of mutant Idh1 disturbs the NSC microenvironment and reduces proliferation within the SVZ.
(a) Immunofluorescent staining comparing the SVZ of hGFAP-Cre (top row) and hGFAP-Cre; Idh1LSL:R132H/WT (bottom row) animals. Staining with the proliferative marker Ki67 (green) shows a decrease in the proliferative cells of this germinal zone. Sox2 (red) marks NSCs and shows a perturbed NSC niche and disorganization to the normal architecture of the region. (DAPI, nuclear stain-blue). Representative images are shown (20x). (b) Quantification of proliferative cells surrounding apex of SVZ indicates decreased proliferation within the subventricular germinal zone of mutant animals. Phenotype observed in 80% of hGFAP-Cre; Idh1LSL:R132H/WT animals (5/6 animals). Quantification derived from 2 animals per genotype, unpaired Student t-test, p=0.0004, error bars indicate SEM. (c) NSCs were quantified by taking three adjacent regions of identical size surrounding the SVZ (as indicated through boxes 1, 2, and 3-not drawn to scale). While the dispersal trend of the NSC population outwards from the SVZ is observed among mutant brains (5/6 animals), the interaction of distance from the ventricle and different genotypes is not statistically different (p=0.148, repeated measures ANOVA). Quantification derived from 2 animals per genotype, 3 regions per slide, error bars indicate SEM. (d) Sox2 positive cells were normalized to overall cell number. An accumulation of NSCs relative to total number of cells is observed in 5/6 mutant animals. Quantification derived from 2 animals per genotype, 2 fields per animal, unpaired Student t-test, p=0.02, error bars indicate SEM. (e) NSCs cultured in vitro were induced to differentiate through the neural lineage. At Day 8 of differentiation, mutant NSCs show a reduction in β-(III)-tubulin staining, a marker of mature neurons (n=3 independent NSC lines per genotype, 3 randomized fields per sample were counted, unpaired Student t-test, p=0.01, error bars indicate SEM).

