Figure 10.

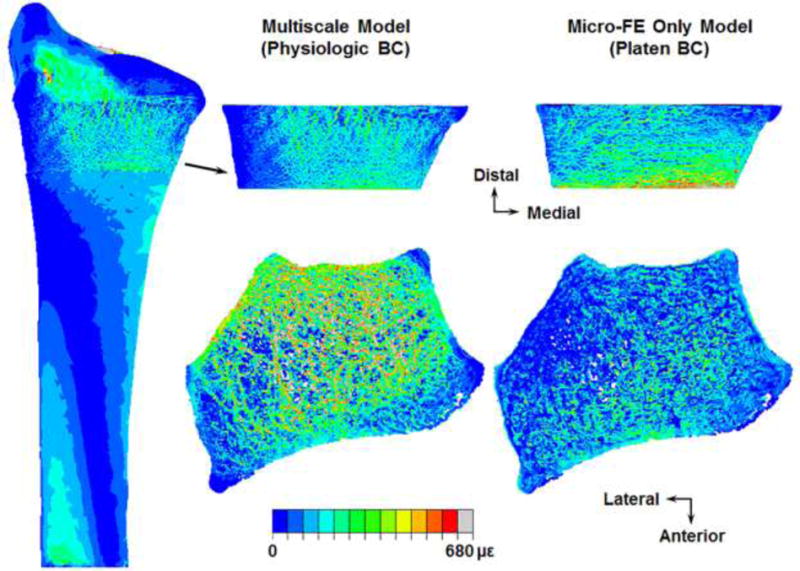
Distribution of maximum principal (tensile) strains on the surface (top row) and through the cross-section (bottom row) of an example micro-FE section simulated under physiologic (multiscale model) and platen boundary conditions (BC).

Distribution of maximum principal (tensile) strains on the surface (top row) and through the cross-section (bottom row) of an example micro-FE section simulated under physiologic (multiscale model) and platen boundary conditions (BC).