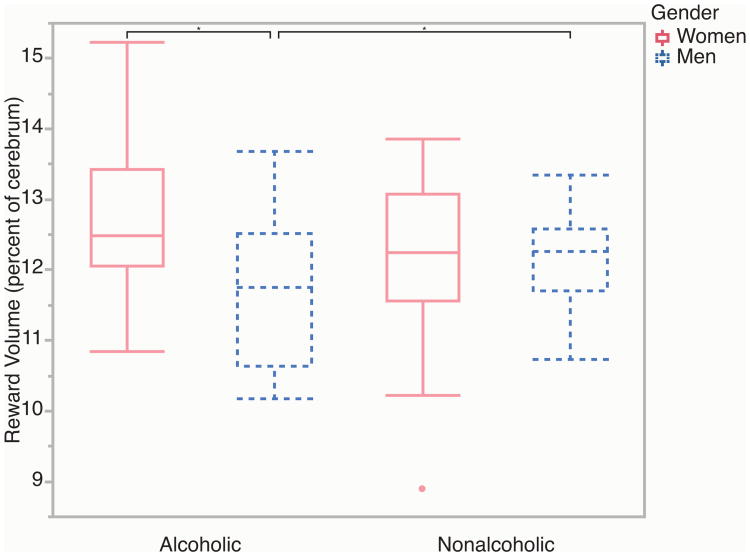
Figure 2.
Reward volumes in alcoholic and nonalcoholic men and women. Lower alcoholism-related reward network volumes were observed for men, but increases were observed for women. Boxplot whiskers represent the most extreme values within double the interquartile range, and the middle band represents the median. There was one outlier, indicated by the red dot, and results did not change when that value was removed. Stars indicate significant differences (p < 0.05).

