Figure 3.

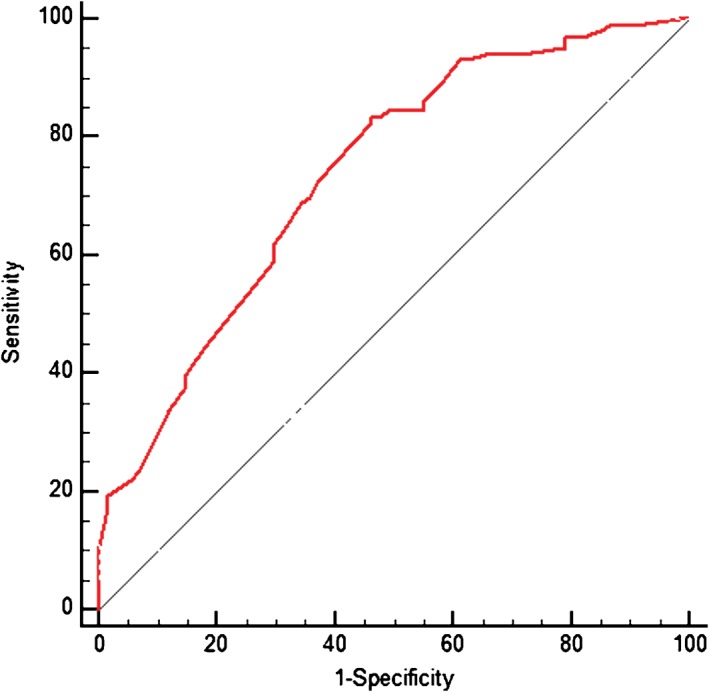
Predicting epidermal growth factor receptor mutation status with clinical variables and computed tomography features by receiver operating characteristic curve (area under the curve 0.737; 95% confidence interval 0.661, 0.814).

Predicting epidermal growth factor receptor mutation status with clinical variables and computed tomography features by receiver operating characteristic curve (area under the curve 0.737; 95% confidence interval 0.661, 0.814).