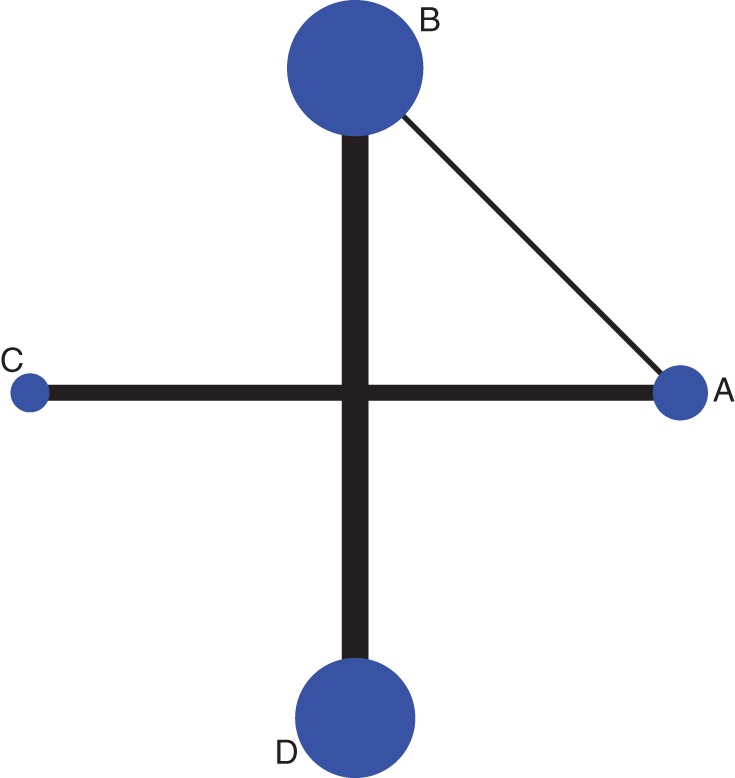
Figure 3.

Network plot of anemia. A: Etoposide with carboplatin, B: etoposide combined cisplatin, C: irinotecan with carboplatin and D: irinotecan with cisplatin. The size of each dot represents the number of patients receiving the corresponding intervention. The width of each line represents the number of studies of corresponding comparison.
