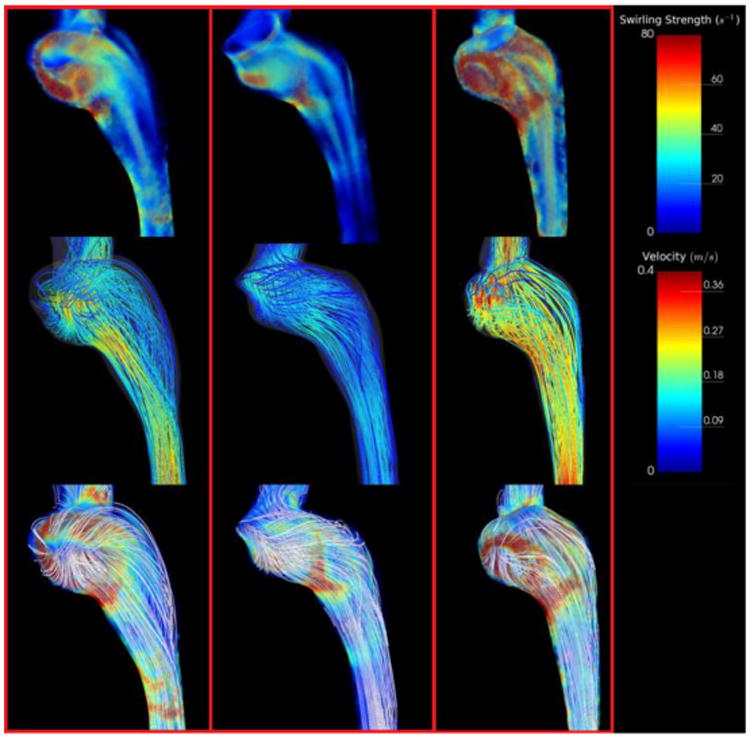
Figure 4.

Simulation results depicting swirling strength and streamlines for all subjects with rounded jugular bulbs. Top Row: Swirling strength distributions throughout the jugular vein representing regions of vortical flow. Note the presence of strong (red) vortex cores in the jugular bulb parallel to flow. Middle Row: Streamlines representing the flow field within the jugular vein. Note that most streamlines from the sigmoid sinus fall straight into the internal jugular vein. Bottom Row: Streamlines visualized with swirling strength. Streamlines are uncolored to emphasize secondary flow structures.
