
Figure 3.
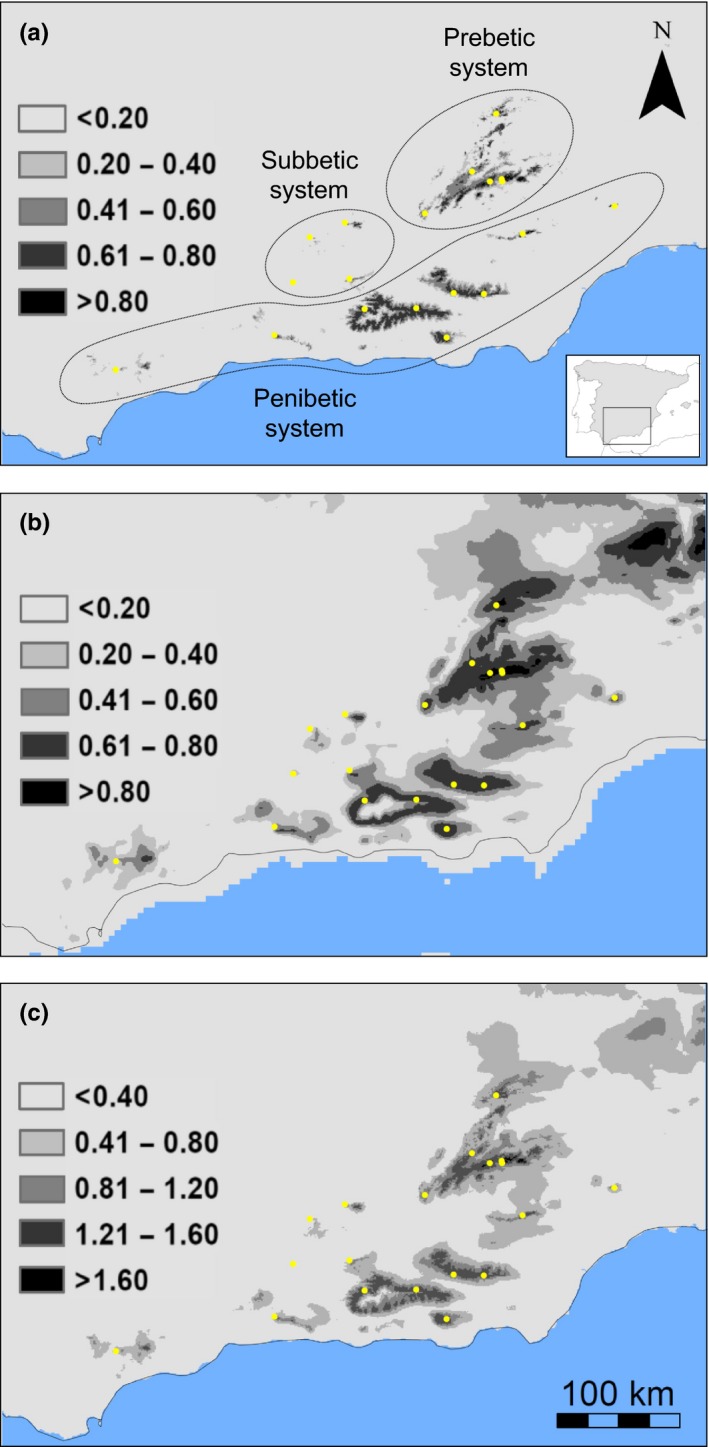
Climate niche modeling for the scrub‐legume grasshopper in southeast Iberia for (a) the present and (b) the last glacial maximum (LGM, c. 21 Kya). Panel (c) shows climate stability estimated as the sum of pixel values of current and LGM climate suitability maps. The LGM maps represent the average climate suitability index of the projections obtained from CCSM and MIROC climate models. Gray scales refer to climate suitability (range: 0–1) and climate stability (range: 0–2), with increasingly darker shades of gray indicating increasing climate suitability and stability. Inset map from panel (a) shows the location of our study area within the Iberian Peninsula