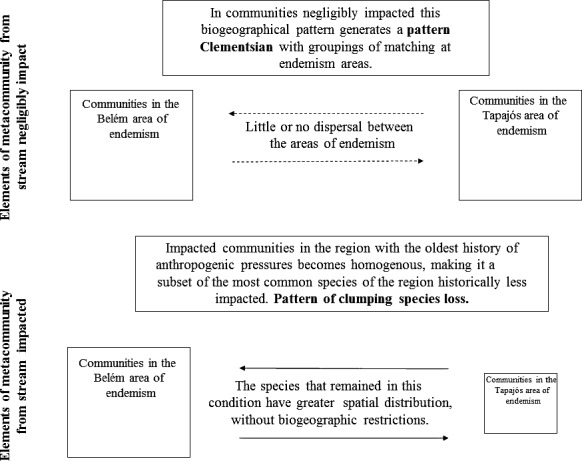
Figure 6.

Graphical model representing the main results of the metacommunities standards. Streams with little change a limiting dispersion (dotted arrows) and communities have distinct compositions between the two biogeographic regions (pattern Clementsian). The second result demonstrates the nested pattern found between regions whereas only impacted communities, this dispersion is not limiting prospects (unbroken lines and arrows) (pattern clumped species loss)
