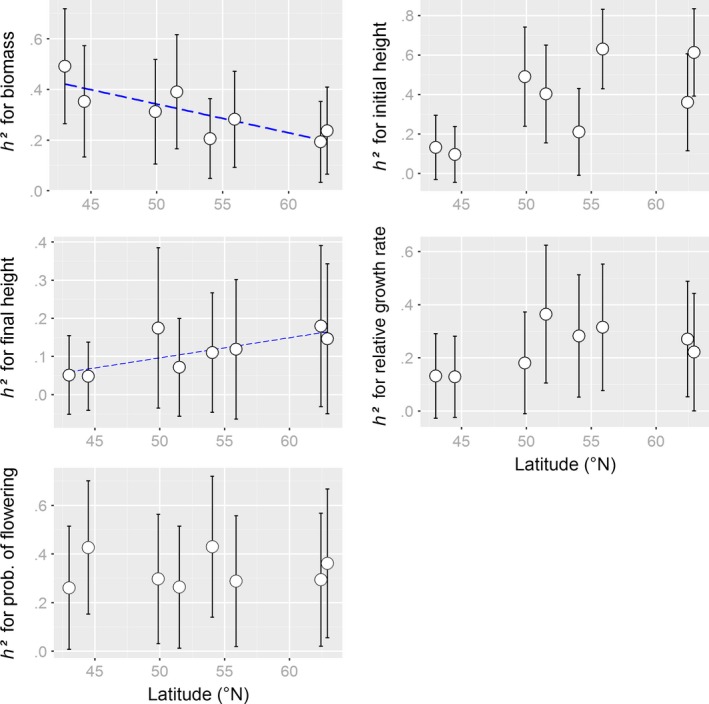
Figure 4.

Latitudinal patterns for estimates of narrow‐sense heritability of vegetative growth variables and flowering in Arrhenatherum elatius. For visualization, a linear regression line (dashed, blue) is plotted for significant correlations. Error bars indicate the standard deviation of the estimates taken directly from the posterior distribution
