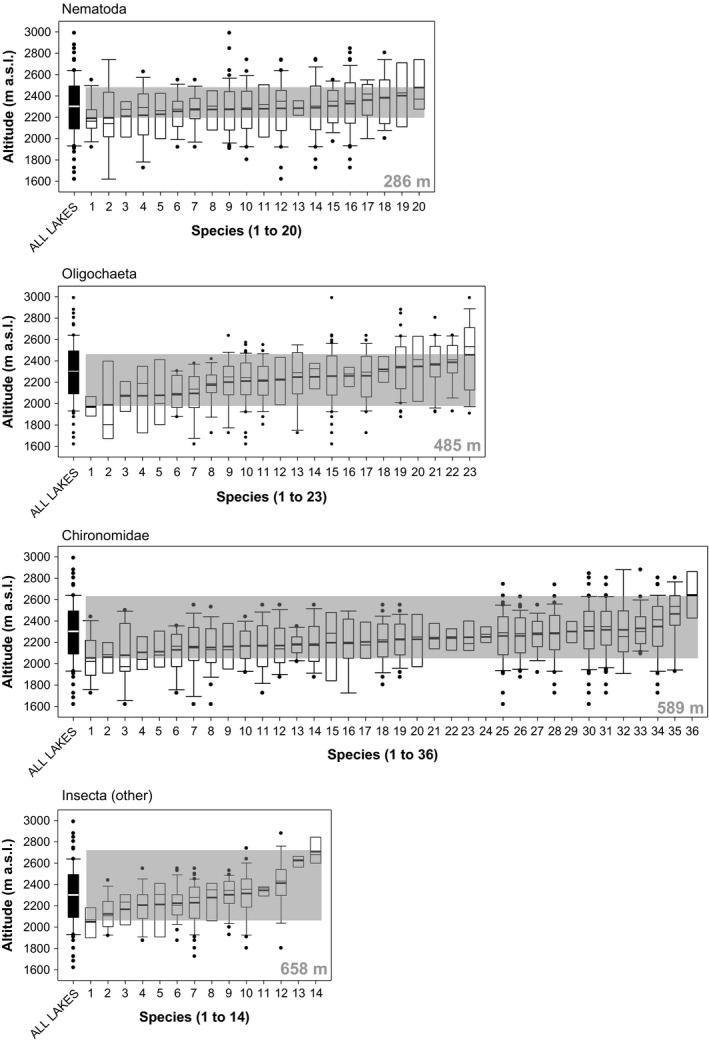
Figure 2.

Altitudinal distribution of nematode species, compared to that of oligochaetes, chironomid insects, and nonchironomid insects, also collected during sampling (82 lakes, ranging from 1,620 to 2,990 m a.s.l.). Species are arranged, from left to right, by increasing means of the altitudinal distributions (short thick horizontal bar inside each box plot). The gray band in each diagram defines the altitudinal range (number given in gray color) between the lowest and the highest mean among the species within each group. Only species present in at least four lakes are considered. Numbers are assigned to each species as indicated in Appendix S2
