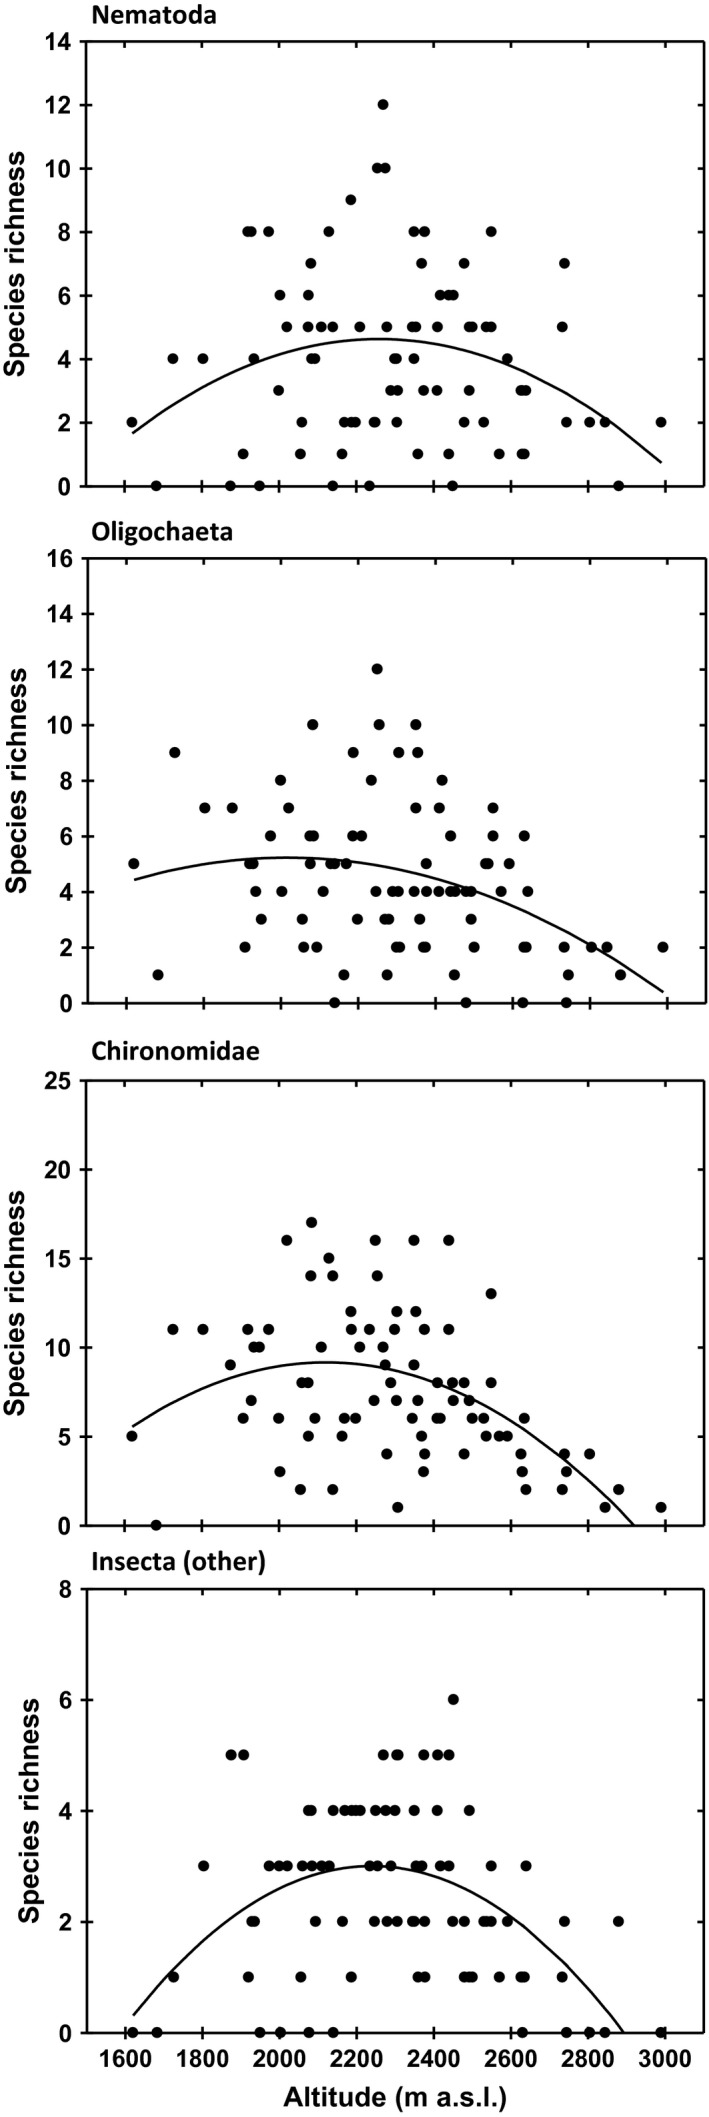
Figure 6.

Species richness patterns across altitude using only species present in at least four lakes (as with the other statistical analysis), for each of the taxonomic groups considered. The quadratic regression model was selected over the simple linear model, in all cases (see Table 2). The same results were obtained when using all species (see Figure S1)
