
Figure 1.
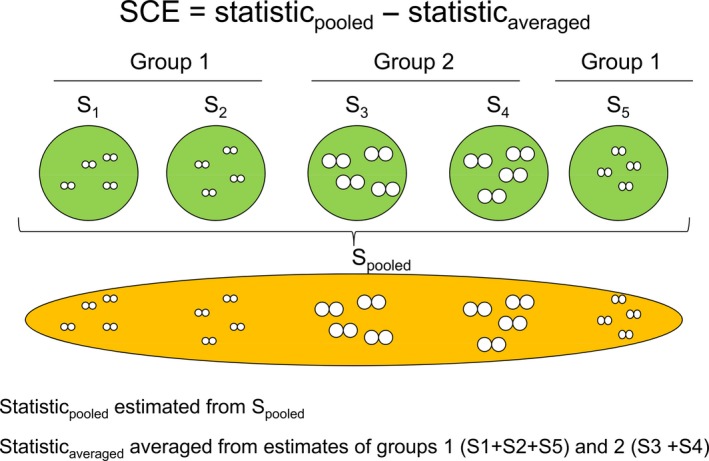
Scheme to explain how scale‐of‐choice effect (SCE) bias is estimated (modified from Ng et al., 2016). The small, white, circles in pairs represent putative mating pairs, while the relative size of these circles is correlated with the trait mean. The SCE occurs as a consequence of pooling mating pairs at a larger scale (S pooled; yellow area), while mate choice is actually produced at a smaller scale (within S1–S5; green areas), and in addition, there are some trait heterogeneity at this scale (between S1 to S5). Therefore, a way to estimate the SCE is to measure the statistic (Pearson's r, C scaled, or C rough) at the pooled level minus the average value within homogeneous groups (Groups 1 and 2). Note that SCE is expressed in the same units than the statistic used