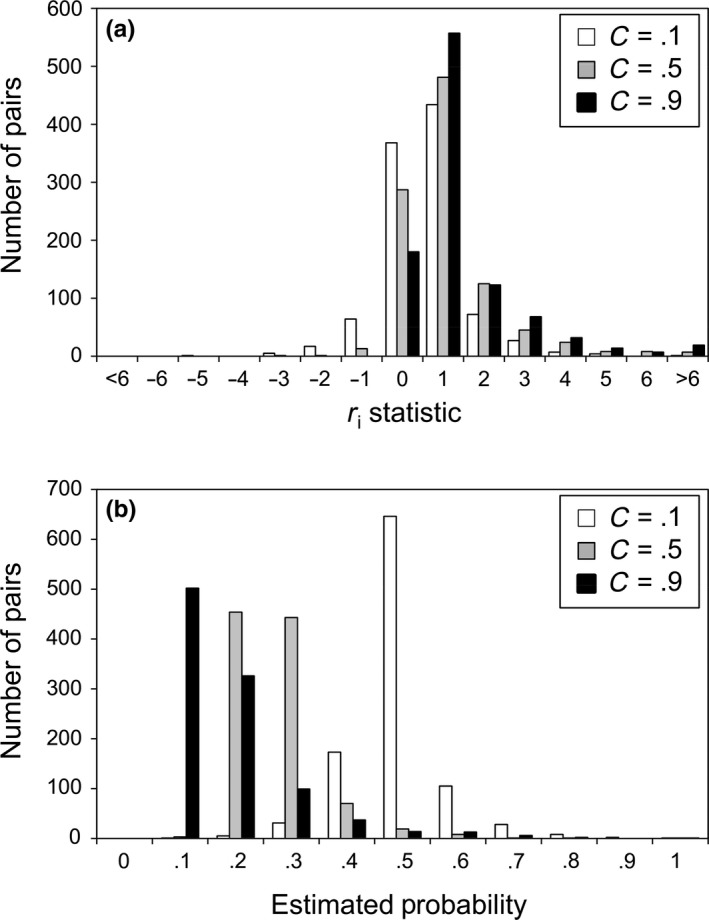
Figure 3.

Example of conversion of r i statistics to mating probabilities for a similar set of putative mating pairs obtained from a population with the same mean and variance and under different mating preferences (C values). (a) Histogram of r i statistic (contribution of each pair to Pearson's r; see Perez‐Figueroa et al., 2008) generated in populations under different a priori strength of mating preferences (C). (b) The former r i values were rescaled from 0.01 to 0.99 to match probability estimates. Note that, as expected, the mating pairs would produce a probability distribution with lower mean P under high preference (C = 0.5), because a high preference would render a high probability exclusively if the pairs show very similar trait values (rare cases with low D)
