
Figure 5.
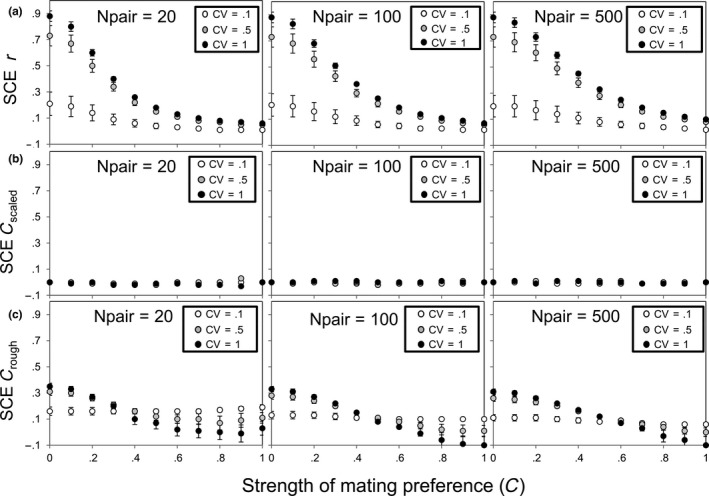
Representation of the magnitude of the mean simulated scale‐of‐choice effect error (Statisticpooled − Statisticaveraged; with corresponding standard errors) for the different estimators of mating preference at different simulated preference strengths (C): (a) Pearson's r, (b) C scaled, and (c) C rough. The relationship is summarized for three representative coefficients of variation (CV) and three mating pair sample sizes (N pair)