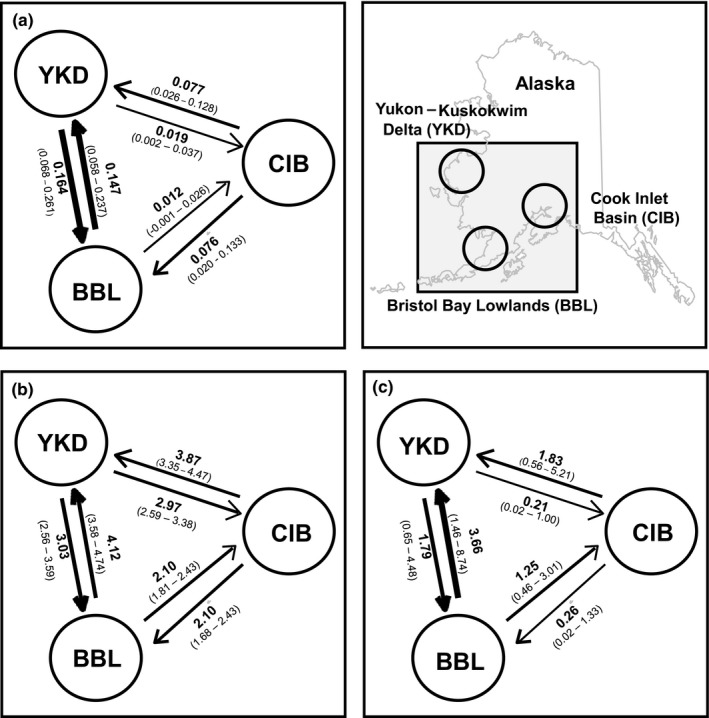
Figure 3.

Rates of gene flow among three populations of greater white‐fronted geese (Anser albifrons) breeding in Alaska. (a) Contemporary gene flow (microsatellite analysis based on BayesAss); (b) Recent gene flow (microsatellite analysis using MIGRATE); and (c) Historical gene flow (analysis of mtDNA control region using MIGRATE). Numbers above arrows represent gene flow rates (proportion of individuals for BayesAss and number of migrants per generation for MIGRATE) in the direction of arrow. Numbers in brackets are 95% confidence intervals. Arrow thickness is scaled according to values
