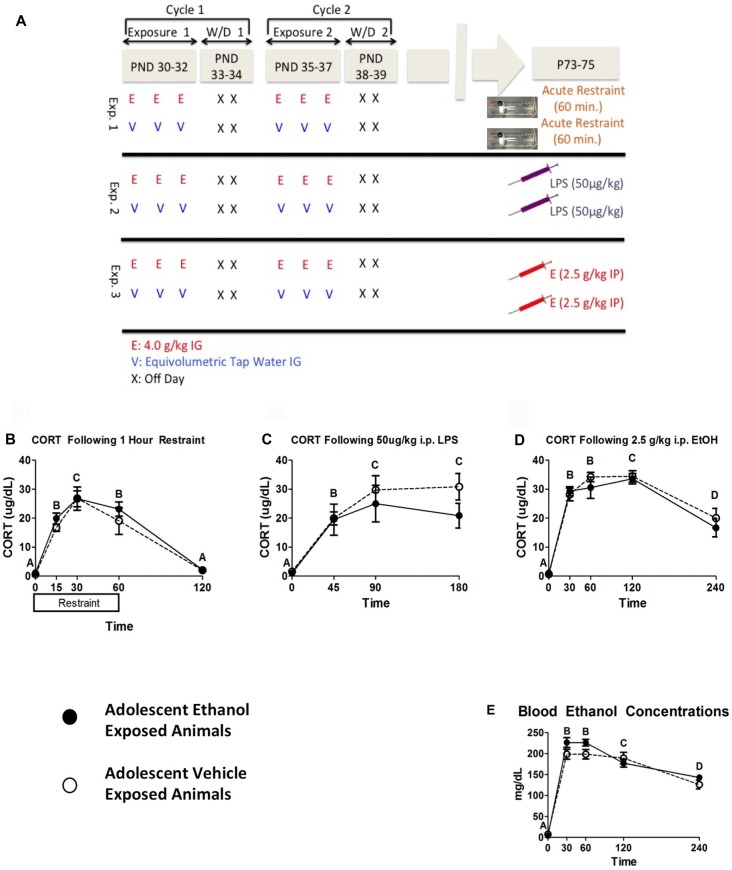
Figure 1.
Plasma Data from Experiments 1–3. This figure shows a schematic diagramming Experiments 1–3 (A). It also shows plasma corticosterone (CORT) levels following 1 h of restraint (B), 50 μg/kg i.p. lipopolysaccharide (LPS) injection (C), and 2.5 g/kg i.p. EtOH injection (D) and corresponding blood ethanol concentrations (BECs) in the ethanol challenge group (E). Plasma was sampled 0, 15, 30, 60 and 120 min following restraint, 0, 45, 90 and 180 min following LPS challenge, and 0, 30, 60, 120 and 240 min following ethanol challenge. A significant main effect of time point is denoted by a lettering system in which time points that differ in letter are significantly different.

