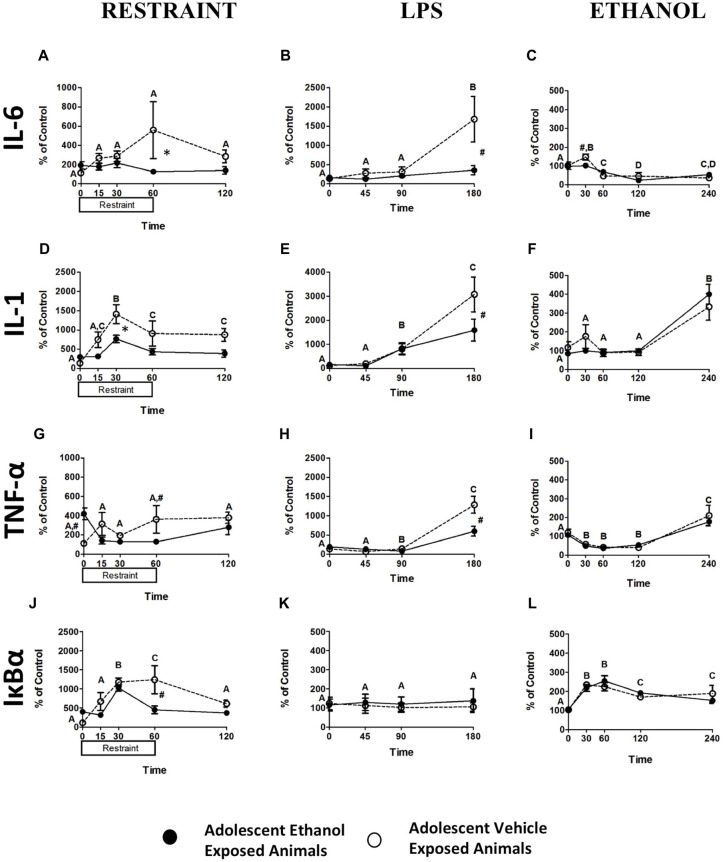
Figure 2.
Cytokine Expression from Experiments 1–3. This figure shows mRNA expression changes following restraint, LPS and ethanol challenge in IL-6 (A–C respectively), IL-1 (D–F respectively), TNF-α (G–I respectively), IκBα (J–L respectively). Samples were collected at 0, 15, 30, 60 and 120 min following restraint, 0, 45, 90 and 180 min following LPS challenge, and 0, 30, 60, 120 and 240 min following ethanol challenge. Data is expressed relative to ultimate control (vehicle animals at the baseline time point) normalized to β-Actin. A significant main effect of time point is denoted by a lettering system in which time points that differ in letter are significantly different. A pound sign indicates a significant interaction between adolescent exposure and challenge stimulus at a given time point. An asterisk indicates a trend interaction between adolescent exposure and challenge stimulus at a given time point. All post hoc comparisons were made using Fisher’s Least Significant Difference post hoc test (p < 0.05).

