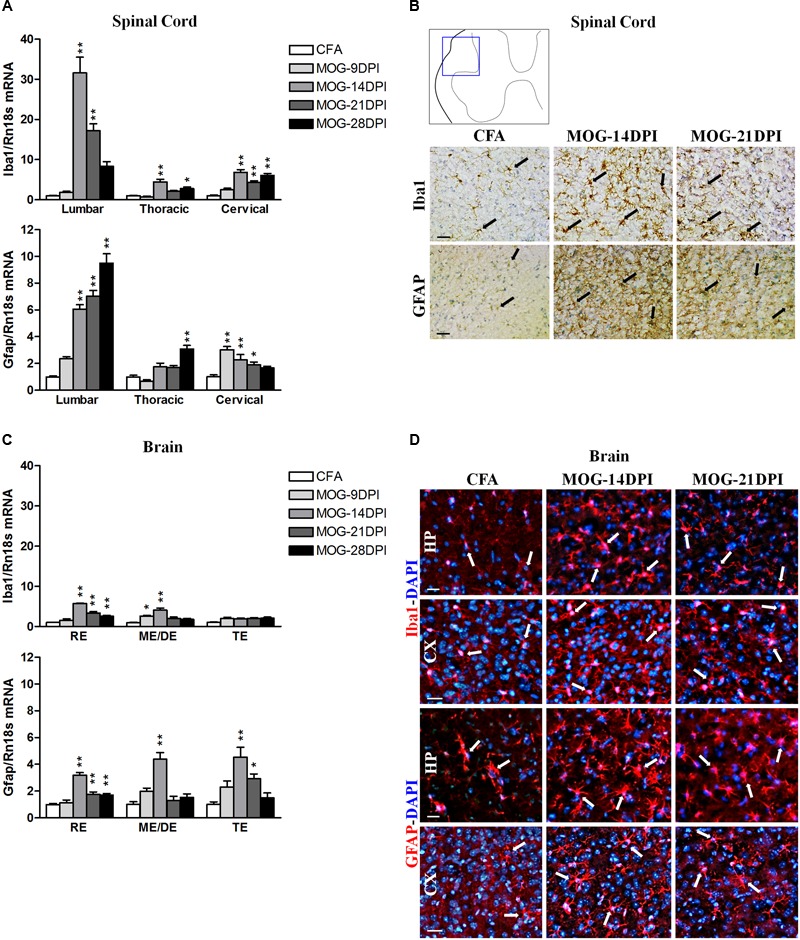
FIGURE 2.

Glial activation in the CNS of MOG-EAE mice. (A) The mRNA expressions of Iba1 (microglial marker) and Gfap (astrocyte marker) were evaluated in spinal cord regions by qRT-PCR during EAE, using Rn18s as the housekeeping gene. (B) Iba1 and GFAP immunoreactivity (arrows) in CFA and MOG-EAE mice spinal cord at 14 and 21 DPI. Results from lumbar spinal cord, as representative of all spinal cord areas studied, are shown. (C) Iba1 and Gfap mRNA expressions in brain areas of CFA and MOG-EAE mice during EAE progression. (D) Immunocytochemistry showing Iba-1 and GFAP positive cells (red) in the CA1 field of the hippocampus (HP) and the temporal cortex (CX). Cells were counterstained with DAPI (blue). Bars represent the means ± SEM of 4–6 animals. ∗p < 0.05, ∗∗p < 0.01 vs. respective CFA; one-way ANOVA and Dunnett post-test. RE, rhombencephalon; ME/DE, mesencephalon/diencephalon; TE, telencephalon. Scale bars: 100 μm.
