FIGURE 4.

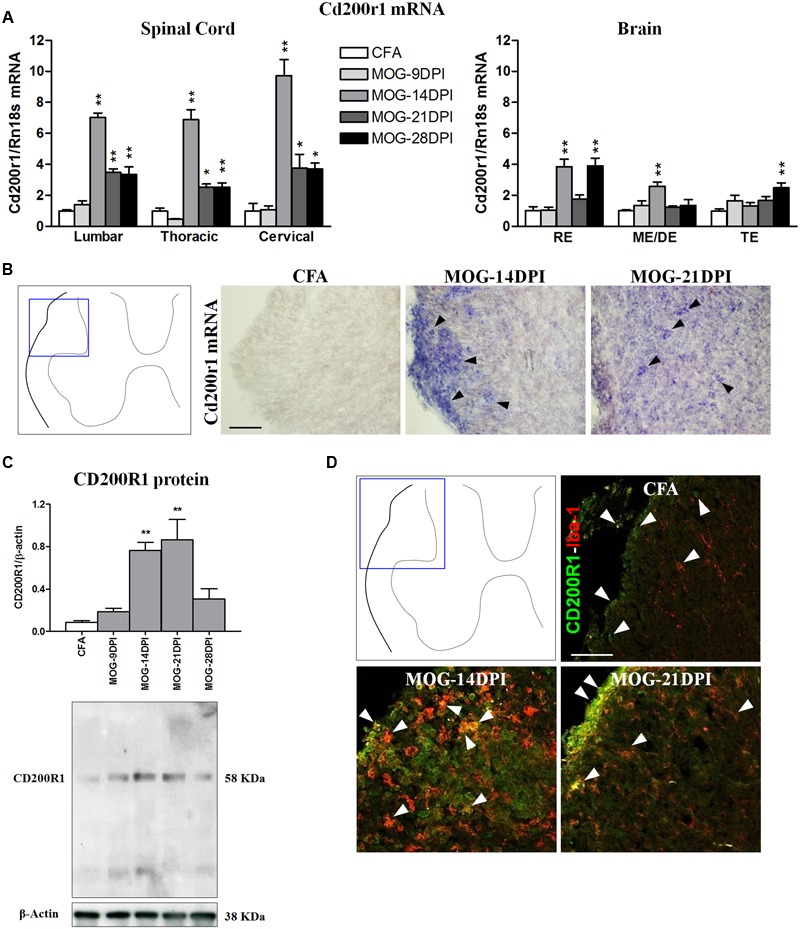
Time course of CD200R1 expression in EAE. (A) Cd200r1 mRNA was evaluated in the spinal cord and brain by qRT-PCR during EAE, using Rn18s as the housekeeping gene. Bars are the means ± SEM of 4–6 animals. ∗p < 0.05, ∗∗p < 0.01 vs. respective CFA; one-way ANOVA and Dunnett post-test. (B) In situ hybridization of Cd200r1 mRNA in the spinal cord. Cd200r1-positive cells (arrowheads) were detected in MOG-EAE mice. (C) CD200R1 protein expression in the spinal cord by western blot using β-actin as the loading control. Bars are the means ± SEM of 4–6 animals. ∗∗p < 0.01 vs. respective CFA; one-way ANOVA and Dunnett post-test. A representative western blot is shown. (D) Double immunofluorescence of CD200R1 (green) and Iba1 (red) in white matter of the spinal cord (arrowheads). Results from lumbar spinal cord, as representative of all spinal cord areas studied, are shown in (B–D). RE, rhombencephalon; ME/DE, mesencephalon/diencephalon; TE, telencephalon. Scale bars: 100 μm.
