
FIGURE 5.
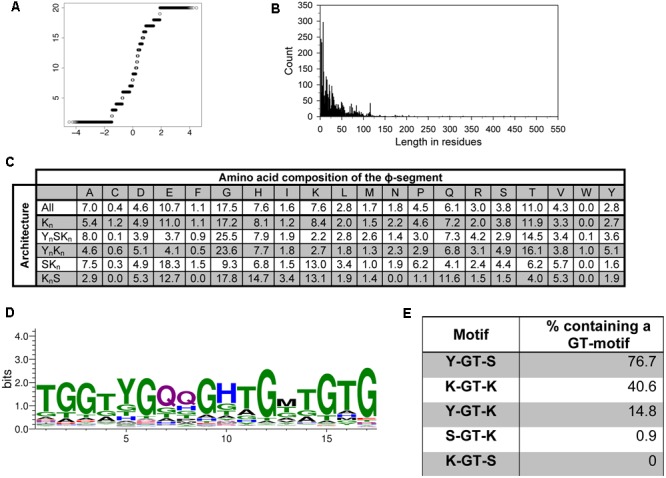
The ϕ-segment sequence is not random. (A) Q–Q plot of the ϕ-segment sequences. (B) Length in residues of the ϕ-segment as a histogram plot. (C) Overall amino acid composition of the ϕ-segment by architecture. The values indicate the percent of all residues that are that particular amino acid in the ϕ-segment. The composition is shown for all dehydrins and for each individual architecture. (D) LOGO representation of the GT-motif. Blue – positively charged (Lys, Arg, His); red – negatively charged (Asp, Glu); black – hydrophobic (Ala, Val, Leu, Ile, Pro, Phe, Met), green – polar (Gly, Ser, Thr, Tyr, Cys), purple – neutral (Asn, Gln). (E) Location of the GT-motifs between the other three segments expressed as percent occurrence for that segment pair.