
FIGURE 8.
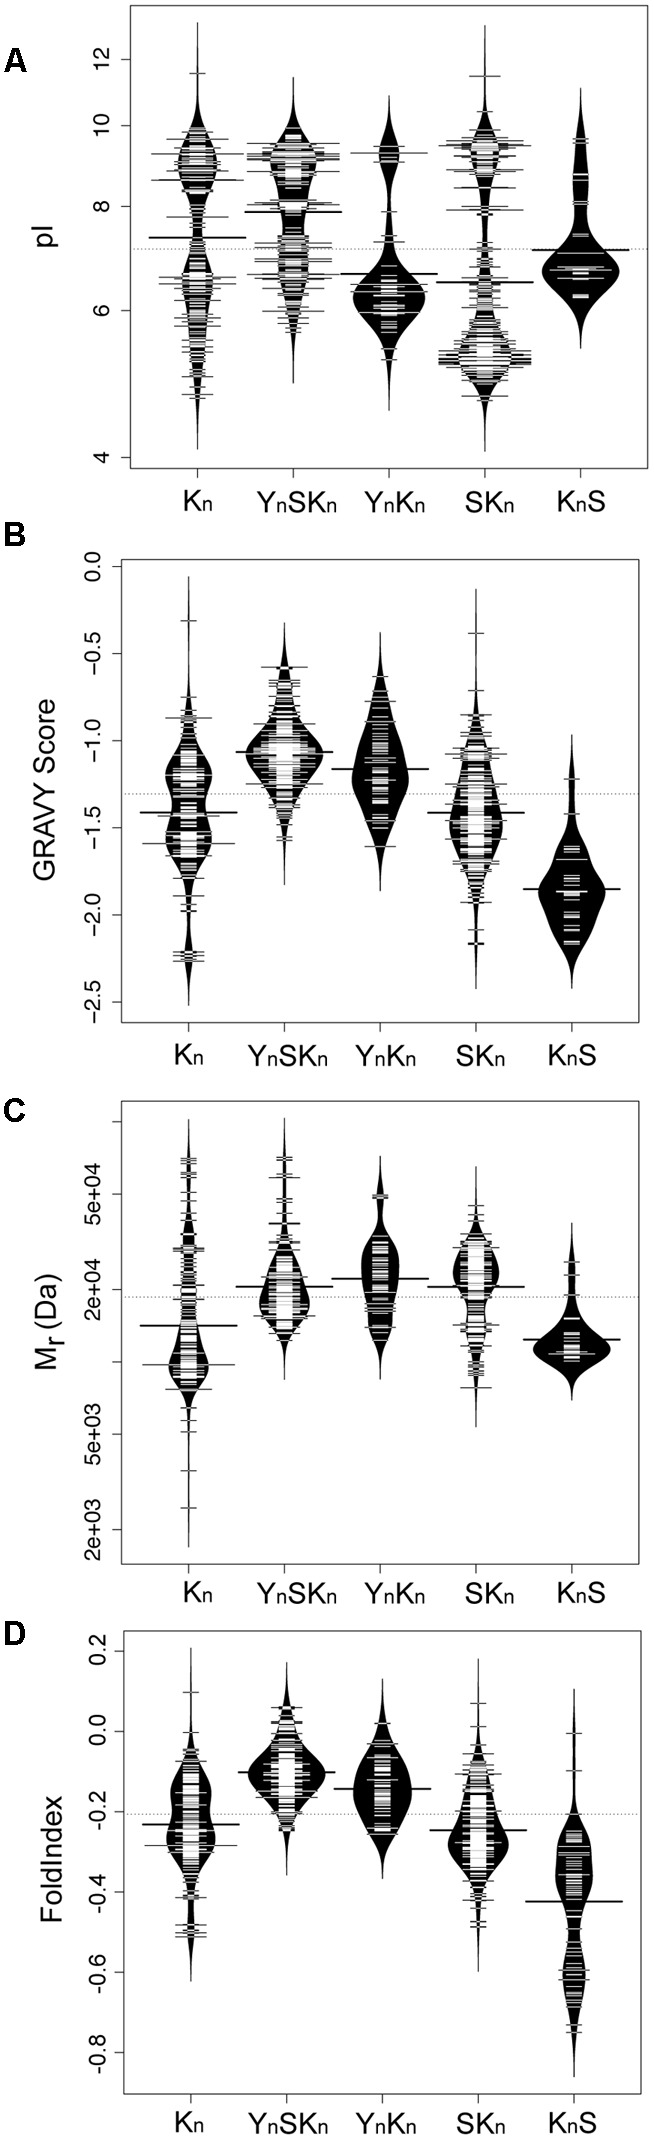
Biochemical properties of dehydrins have unimodal and bimodal distributions. Bean plots of (A) isoelectric point (pI), (B) GRAVY score, (C) molecular mass (Mr), and (D) FoldIndex score of dehydrins categorized by the five architectures (Kn, YnSKn, SKn, YnKn, and KnS). The thin bars represent an individual protein while the wide black bar represents the mean of each group. The violin shapes represent the density of values. The dotted line represents the mean value of all dehydrins over all of the architectures. The y-axes of the GRAVY and FoldIndex scores are linear scales while the Mr and pI are logarithmic scales.