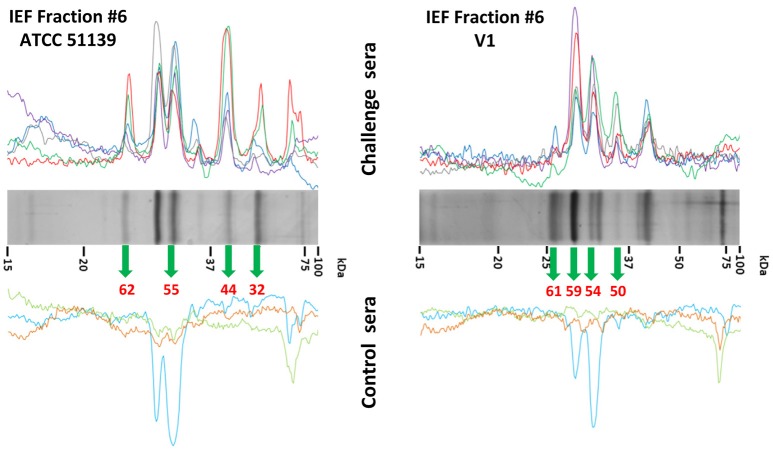
Figure 3.
Identification of immunoreactive proteins in the IEF fractions of the Brachyspira proteomes. The image shows the Western blot densitometry profiles (top and bottom) and the protein band profile of the corresponding silver-stained gel lane (center). Immunoreactivity traces for the 5 sera from challenged pigs (top) and the 3 sera for control pigs (bottom) are shown with different colors (see SI for color codes). Bands identified as immunoreactive were sliced from the SDS gel lane and submitted to MS analyses for identification. Code numbers for the bands analyzed from these specific lanes are indicated in red. The example given corresponds to the IEF fractions #6 from ATCC 51139 (B. pilosicoli) (left) and V1 (B. hyodysenteriae) (right) strains. The full set of images for all the fractions is given in Supplementary Figures S5A–H.

