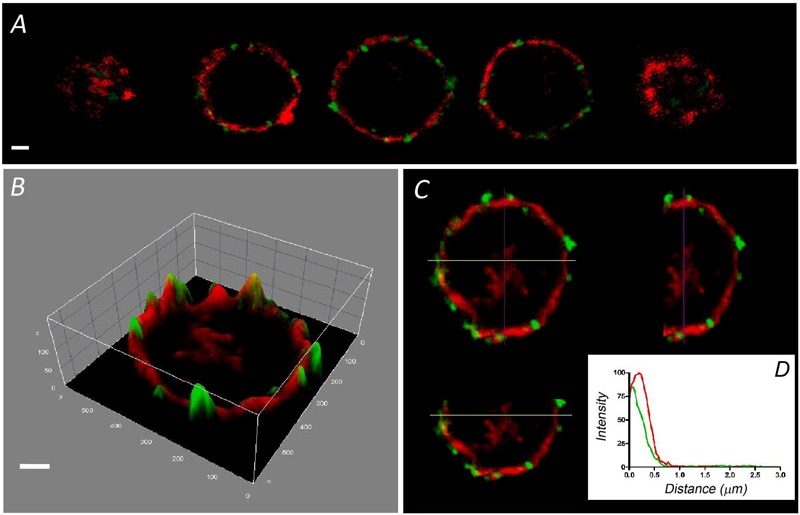
FIGURE 1.

Distribution of F-actin in cultured bovine chromaffin cells. Sequential confocal images of a representative chromaffin cell in culture labeled with rhodamine–phalloidin (red fluorescence), and anti-SNAP 25 in green (A). (B) The intensity distribution of the central image of (A) is shown depicting the concentration of fluorescence at the cell periphery. A pseudo-3 D reconstruction highlights the peripheral labeling present in the three spatial axis (C). (D) The individual fluorescence profiles were averaged to obtain the distribution of F-actin fluorescence relative to the position of the plasma membrane labeled with anti-SNAP-25 (green). Data from cultured cells (n = 16 cells, two different cell preparations). Bars in (A,B) represent 1 μm.
