FIGURE 3.

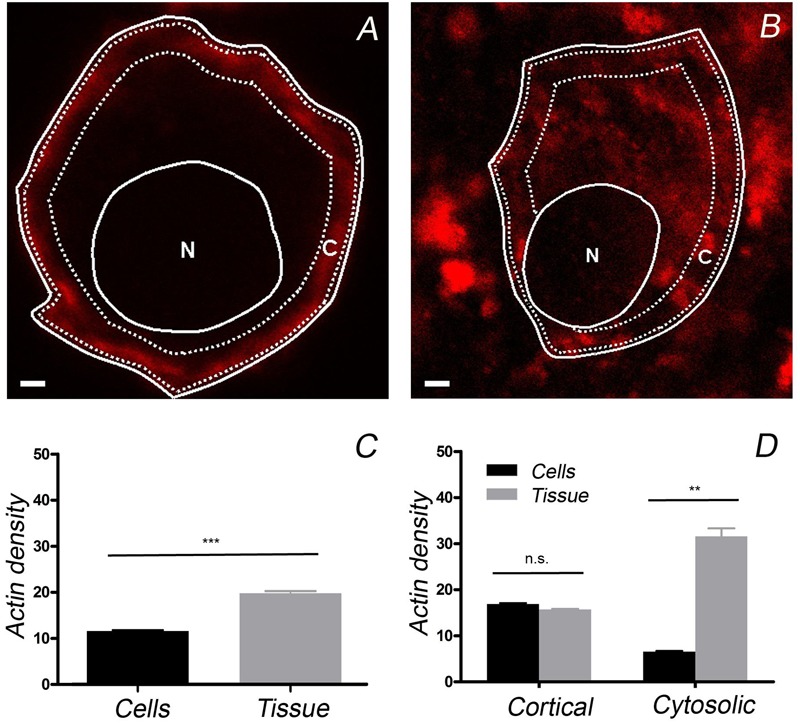
Quantification of the F-actin density in cultured chromaffin cells and in cells present in the adrenal medulla. Confocal images of F-actin labeled with rhodamine–phalloidin were used to calculate the F-actin density in the whole cell and in the cortical region (“C”), as well as in the cytoplasm (excluding the nuclear zone, “N”). The average F-actin density appeared to be higher in the cells forming part of the adrenomedullary tissue (C), mainly due to the presence of abundant cytoplasmic F-actin in the cells present in this tissue (D). A similar density of cortical F-actin is evident in cultured cells (n = 20 cells) and those forming part of the adrenomedullary tissue (n = 20 cells). Bars in (A,B) represent 1 μm. ∗∗P < 0.005, ∗∗∗P < 0.0005 using the two-way ANOVA test.
