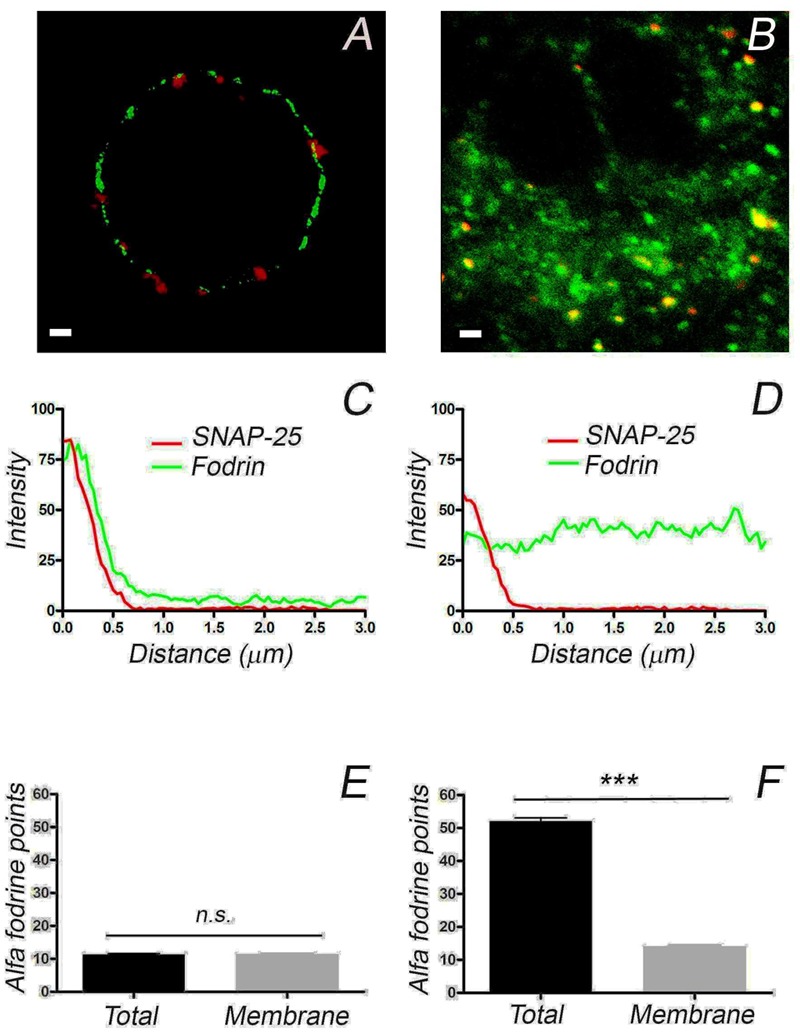
FIGURE 4.

The distribution of α-fodrin in cultured cells and cells from adrenomedullary slices. Confocal images of α-fodrin (green fluorescence) and anti-SNAP-25 (red fluorescence) used to calculate the density of α-fodrin in the whole cell and at the plasma membrane (Membrane), as indicated in the previous Figure. Individual density profiles were used to obtain the averaged α-fodrin profiles from cultured cells (C, n = 11, 2 cell preparations) and in cells from adrenomedullary slices (D, n = 16, 2 adrenal medulla preparations). The average total α-fodrin patches appear to be much higher in the cells forming part of the adrenomedullary tissue (F), this being due to the abundant cytoplasmic α-fodrin. There are a similar number of membrane associated α-fodrin patches in cultured cells and cells from the adrenomedullary tissue (E,F). Bars in (A,B) represent 1 μm. ∗∗∗P < 0.0001 using the two-way ANOVA test.
