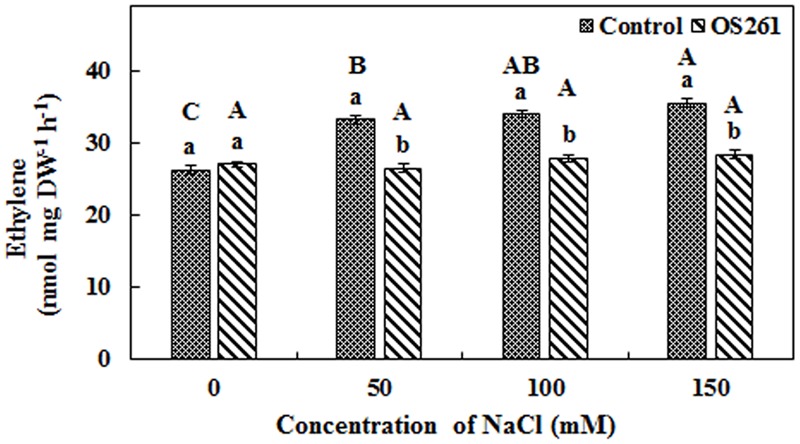
FIGURE 2.

Effect of P. frederiksbergensis OS261 on ethylene production by red pepper seedlings under 0, 50, 100, and 150 mM salinity stress. Different letters indicate significant differences P < 0.05 among the treatments at each salt levels (a, b) or among salt levels for each treatment: Control (A, B, C, D), OS261 (A, B, C, D). Each value represents the mean of six replicates ± standard error (SE).
