FIGURE 2.

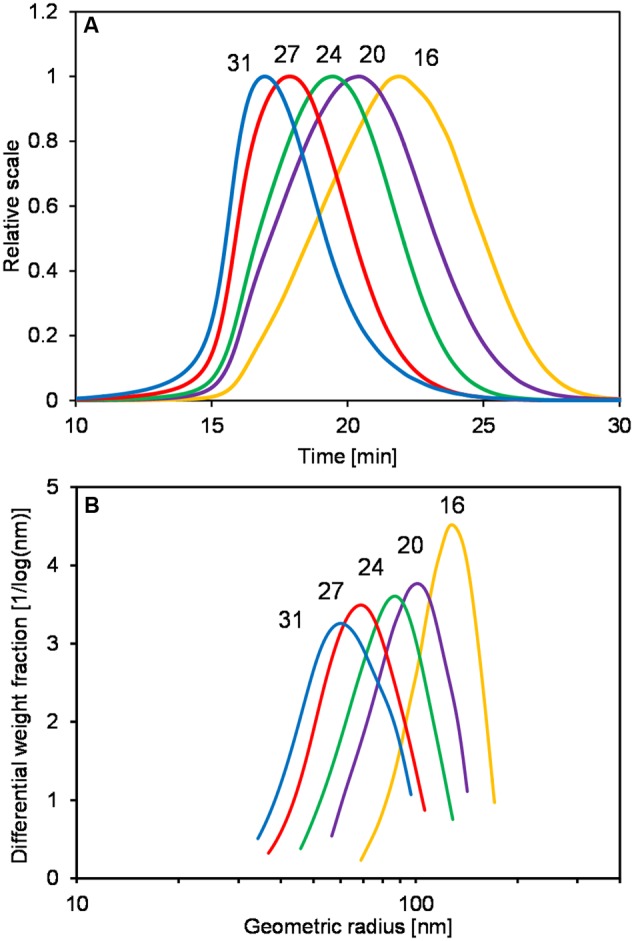
Light scattering (LS) signals at 90° (A) and size distributions of the geometric radius (B) of levan samples, which were produced without pH control and were isolated at different time points.

Light scattering (LS) signals at 90° (A) and size distributions of the geometric radius (B) of levan samples, which were produced without pH control and were isolated at different time points.