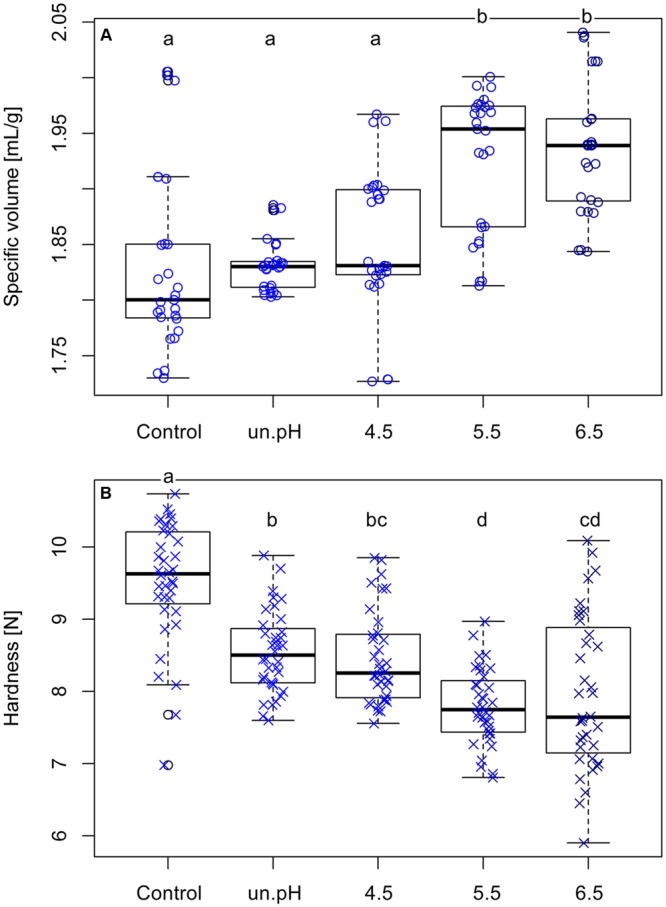
FIGURE 6.

Comparisons of the loaf specific volume (A) and crumb hardness (B) of control breads and breads with 1% addition of isolated levan produced at different pH conditions. Data are from three separated bakings. Different letters indicate significant differences among treatments (p < 0.05).
