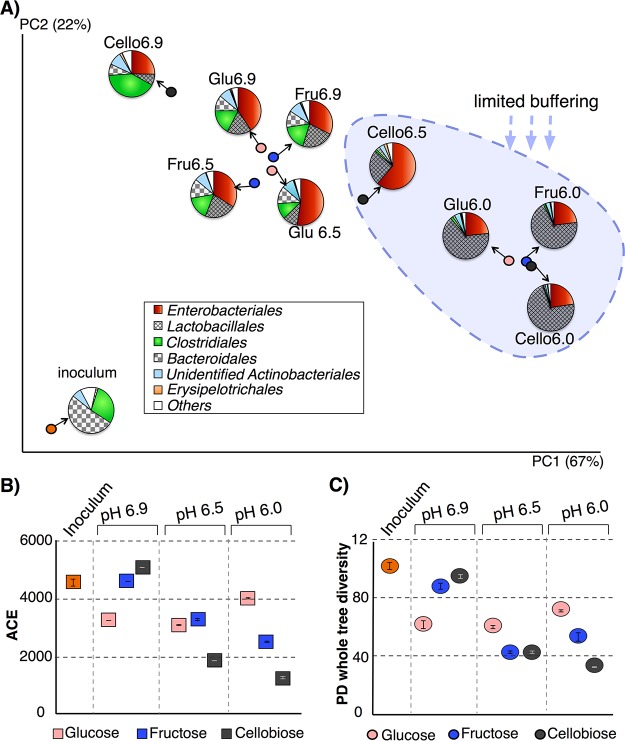
FIG 1 .
(A) Weighted UniFrac (32) analysis visualized on principal coordinates shows that mainly the initial pH along with buffering determined the main phylotypes that drove the community structures in the system. Each circle represents microbial communities from pooled DNA samples from triplicate reactors. (B and C) Abundance-based coverage estimator (ACE) (33) (B) and PD whole-tree (34) (C) indices calculated from 16S rRNA gene sequences for inoculum and pH 6.0, 6.5, and 6.9 cultures.

