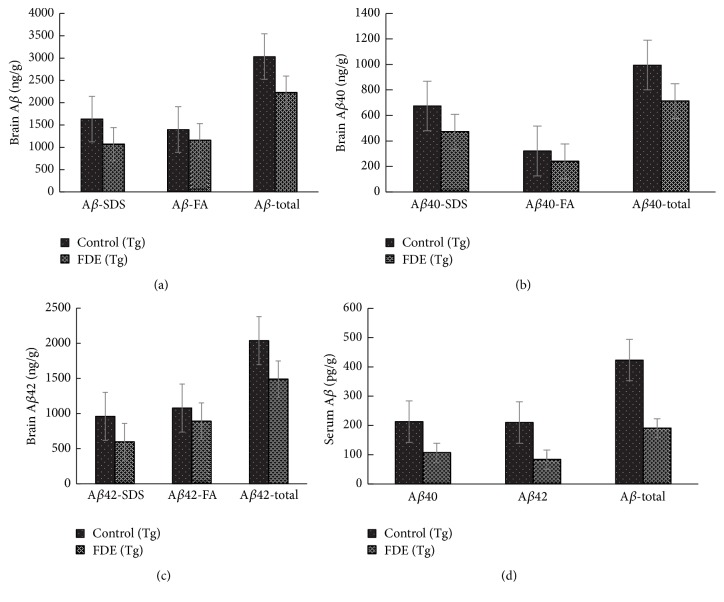
Figure 6.
Effects of FDE consumption on Aβ levels in the brain and serum of APP/PS1 transgenic mice. (a) Comparison of total Aβ, Aβ in SDS fraction (Aβ-SDS), and Aβ in formic acid fraction (Aβ-FA) among groups. (b) Comparison of total Aβ40, Aβ40-SDS, and Aβ 40-FA. (c) Comparison of total and Aβ42-FA. (d) Comparison of total, Aβ42, Aβ42-SDS Aβ 40, and Aβ 42 in serum. Denote p < 0.05 or p < 0.01 versus APP/PS1 transgenic mice fed with control diet. Scale bar, 1 mm.

