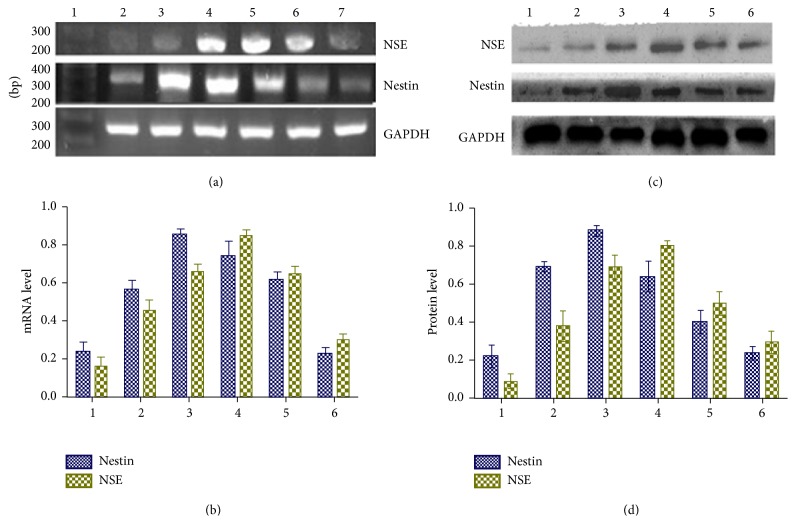
Figure 4.
mRNA and protein levels of nestin and NSE in resveratrol-treated hUC-MSCs. (a) Original gel images and (b) summary data showing mRNA levels of nestin and NSE in resveratrol-treated hUC-MSCs at different time points. (c) Gel images and (d) summary data showing protein levels of nestin and NSE in resveratrol-treated hUC-MSCs at different time points. 1–6: period of resveratrol treatment for 0 (control), 2 h (3), 4 h (4), 6 h (5), 12 h (6), and 24 h (7).

