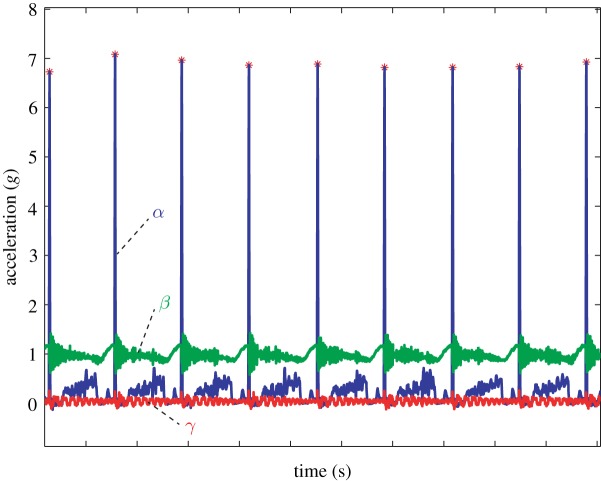
Figure 5.
Representative acceleration time histories for the impact testing from the pendulum apparatus shown in figure 4. The blue curve (labelled α) represents the accelerations experienced by the knot in the impact direction. The green curve (labelled β) and red curve (labelled γ) represent off-axis accelerations in the vertical and lateral directions, respectively. (Online version in colour.)

