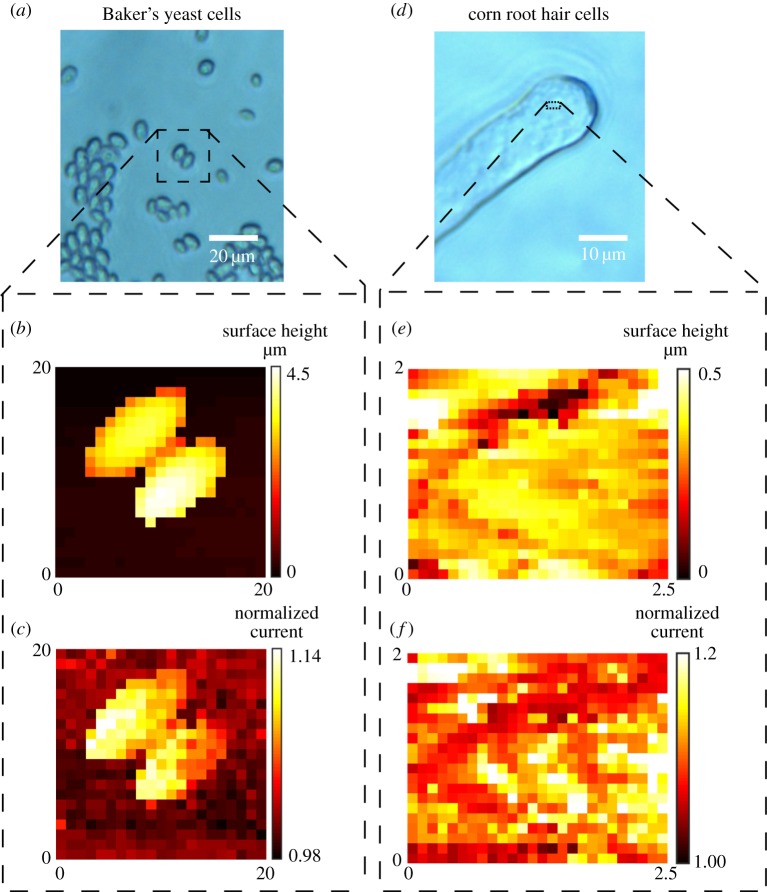
Figure 10.
BM-SICM topography and surface charge mapping of Baker's yeast cells (a–c) and root hair cells (d–f) in 10 mM KCl with the presentation of optical images (a,d), topographical data (b,e) and normalized ionic current data at a bias of 0.4 V (c,f), as a proxy for surface charge. The scan areas are represented on the optical images by a black dashed square.

