
Figure 9.
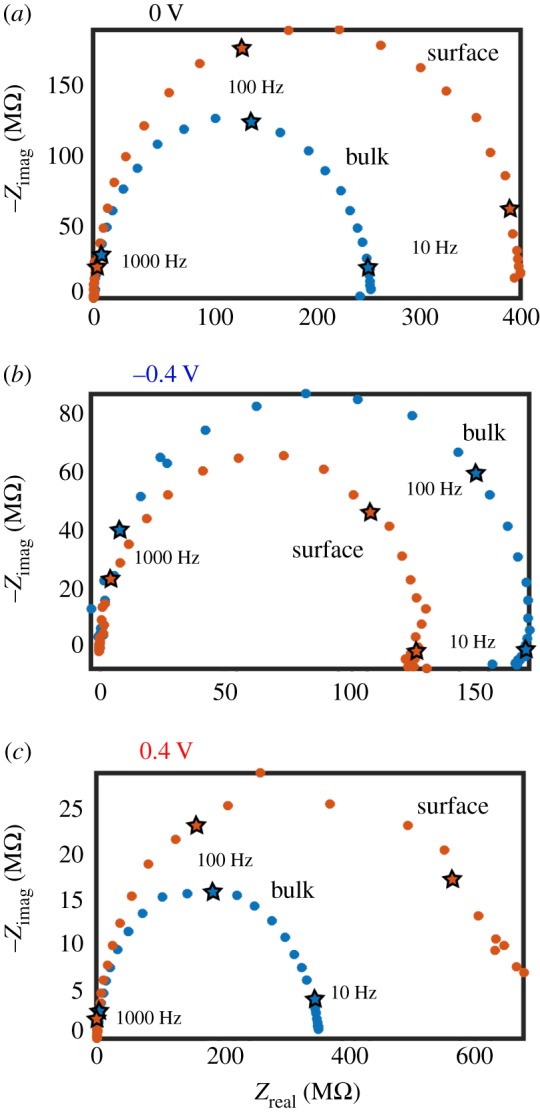
Nyquist plots representing impedance data for an SICM configuration, with a nanopipette in 10 mM KCl aqueous solution (approx. pH 6.5) with a 10 mV oscillation applied on top of a fixed bias of (a) 0 V, (b) −0.4 V and (c) 0.4 V. The nanopipette was positioned either in bulk solution (blue) or near a glass substrate (orange). Data points corresponding to decades in frequency are denoted by stars and labelled according to the frequency.