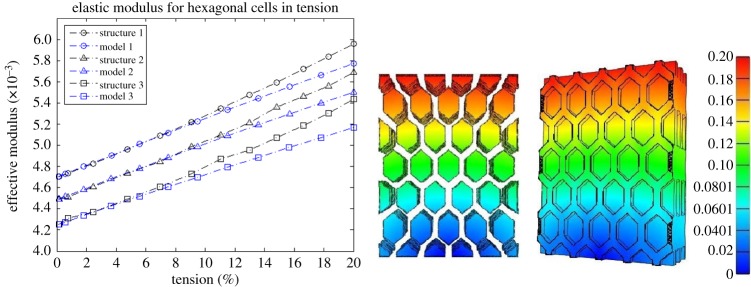
Figure 3.
A comparison between model (continuous line) and simulation (dashed line) of the effective elastic modulus. The cell-core is 10 times softer than the cell walls for structure 1, 20 times softer than the cell walls for structure 2, and 100 times softer than the walls for structure 3. The closed hexagonal prismatic cells and their inclusions are shown at 20% (right) tension in the vertical direction (colour bar showing the displacement in the same direction) is shown. (Online version in colour.)

