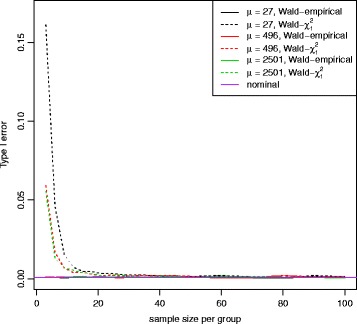
Fig. 13.

False positive error rate plot for the Wald test with equal dispersion parameters for TCGA breast cancer data set. False positive error rate was calculated for the Wald test with the empirical distribution (solid line) or with a chi-square distribution with 1 degree of freedom (dotted line) at 3 different mean expression levels and 19 different sample sizes (range 3-100). The nominal false positive error rate for the Wald test with the empirical distribution is shown in purple line (α=0.001). Wald test with the chi-square distribution has the inflated false positive error rates
