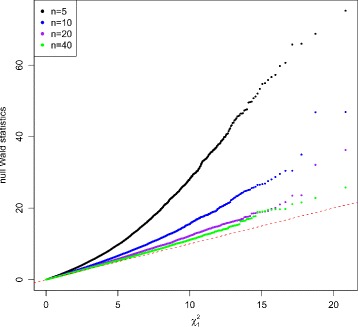
Fig. 2.

QQ plot of null Wald statistics with equal dispersion parameters. Data were simulated 100,000 times with μ=20 under the null hypothesis. Sample sizes were set at n=5,10,20,and 40. Wald test was used for testing mean difference between two conditions. The discrepancy of the null Wald statistics from chi-square distribution with 1 degree of freedom gets smaller when sample size increases
