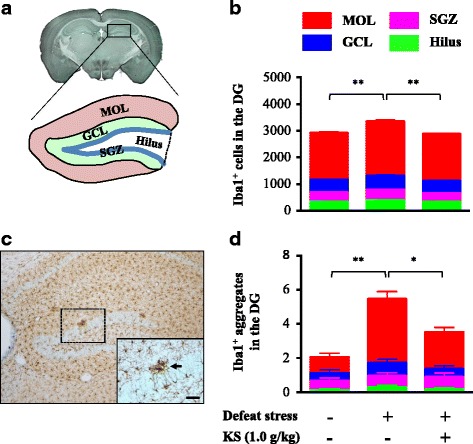
Fig. 4.

Kososan extract inhibited the stress-induced increase in hippocampal microglia in mice. On day 13, Iba1 staining was performed on six coronal brain sections per mouse. a A schematic diagram of the four subregions of the DG in the hippocampus. b The count of Iba1-positive cells in the four subregions of the DG. c A representative photomicrograph of the DG depicts microglial marker Iba1-positive (brown-stained) cells. The arrow in the inset shows an Iba1-positive aggregate. Scale bar = 20 μm. d The count of Iba1-positive aggregates in the four subregions of the DG is shown. Data are presented as the mean ± SEM (n = 18–19 per group). *p < 0.01 and **p < 0.001 according to Bonferroni’s post hoc test. MOL molecular layer, GCL granular cell layer, SGZ subgranular zone, DG dentate gyrus, KS kososan
