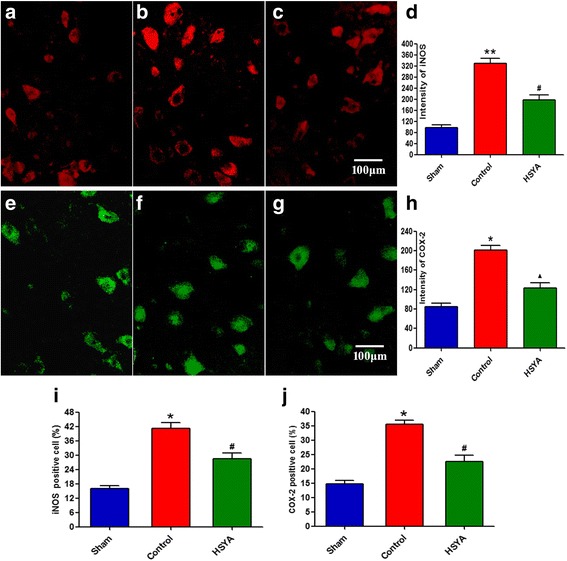
Fig. 6.

The immunohistochemical staining of iNOS (a to c) and COX-2 (e to g) 48 h after SCI. The quantitative analysis of iNOS and COX-2 from spinal cord tissues in each experimental group has been assessed; bar graphs represent the mean optical density of iNOS (d) and COX-2 (h), respectively. iNOS and COX-2-positive apoptotic cells (i and j, respectively) in spinal cord lesions were also quantified by counting the total number of positive nuclei through entire cross sections by an independent observer. Quantitative analysis was based on at least five fields per section of five rats, separately. (*P < 0.05 vs. sham group; **P < 0.01 vs. sham group; ▲ P < 0.05 vs. sham group; P < 0.01 vs. control group; #P < 0.01 vs. control and sham group)
